Estimated Value: $440,439 - $535,000
--
Bed
1
Bath
2,380
Sq Ft
$204/Sq Ft
Est. Value
About This Home
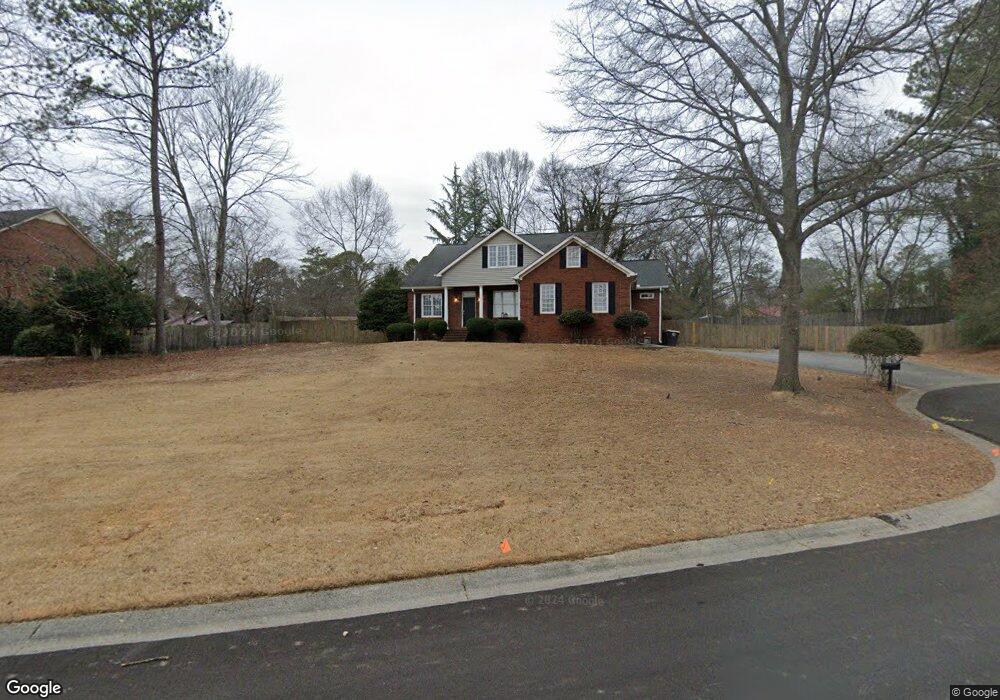
This home is located at 13 N Ivy Ridge Rd SE, Rome, GA 30161 and is currently estimated at $484,610, approximately $203 per square foot. 13 N Ivy Ridge Rd SE is a home located in Floyd County with nearby schools including Dan McCarty Middle School, Rome High School, and St. Mary School.
Ownership History
Date
Name
Owned For
Owner Type
Purchase Details
Closed on
Mar 31, 2009
Sold by
Alisago Carrie S
Bought by
Alisago Carrie S
Current Estimated Value
Home Financials for this Owner
Home Financials are based on the most recent Mortgage that was taken out on this home.
Original Mortgage
$193,000
Outstanding Balance
$123,571
Interest Rate
5.18%
Mortgage Type
New Conventional
Estimated Equity
$361,039
Purchase Details
Closed on
Mar 4, 2009
Sold by
Wiggins Phillip W
Bought by
Landamerica Onestop Inc
Home Financials for this Owner
Home Financials are based on the most recent Mortgage that was taken out on this home.
Original Mortgage
$193,000
Outstanding Balance
$123,571
Interest Rate
5.18%
Mortgage Type
New Conventional
Estimated Equity
$361,039
Purchase Details
Closed on
Nov 21, 2000
Sold by
Wiggins Phillip W
Bought by
Wiggins Phillip W and Tracy Wiggin
Purchase Details
Closed on
Jan 31, 1997
Sold by
Smith Stewart G and Smith Paul E
Bought by
Wiggins Phillip W
Purchase Details
Closed on
Jun 16, 1993
Bought by
Smith Stewart G and Smith Paul E
Create a Home Valuation Report for This Property
The Home Valuation Report is an in-depth analysis detailing your home's value as well as a comparison with similar homes in the area
Home Values in the Area
Average Home Value in this Area
Purchase History
| Date | Buyer | Sale Price | Title Company |
|---|---|---|---|
| Alisago Carrie S | -- | -- | |
| Alisago Carrie S | $247,500 | -- | |
| Landamerica Onestop Inc | $262,500 | -- | |
| Wiggins Phillip W | -- | -- | |
| Wiggins Phillip W | $30,500 | -- | |
| Smith Stewart G | -- | -- |
Source: Public Records
Mortgage History
| Date | Status | Borrower | Loan Amount |
|---|---|---|---|
| Open | Landamerica Onestop Inc | $193,000 |
Source: Public Records
Tax History Compared to Growth
Tax History
| Year | Tax Paid | Tax Assessment Tax Assessment Total Assessment is a certain percentage of the fair market value that is determined by local assessors to be the total taxable value of land and additions on the property. | Land | Improvement |
|---|---|---|---|---|
| 2024 | $4,414 | $170,333 | $16,380 | $153,953 |
| 2023 | $4,387 | $166,038 | $16,380 | $149,658 |
| 2022 | $4,025 | $141,654 | $15,600 | $126,054 |
| 2021 | $3,701 | $119,520 | $15,600 | $103,920 |
| 2020 | $3,646 | $114,953 | $15,600 | $99,353 |
| 2019 | $3,531 | $110,147 | $15,600 | $94,547 |
| 2018 | $3,445 | $105,245 | $15,600 | $89,645 |
| 2017 | $3,289 | $96,256 | $15,600 | $80,656 |
| 2016 | $3,272 | $94,800 | $15,600 | $79,200 |
| 2015 | $3,125 | $96,080 | $15,600 | $80,480 |
| 2014 | $3,125 | $96,080 | $15,600 | $80,480 |
Source: Public Records
Map
Nearby Homes
- 36 Busby Dr SE
- 38 Busby Dr SE
- 11 Breckenridge Rd SE
- 9 Heather Rd SE
- 100 Valley Brook Dr SE
- 14 Mitchell Cir SE
- 13 E Lakeshore Dr SE
- 22 Robin Hood Rd NE
- 230 Old Freeman Ferry Rd SE
- 4 Covey Rise Dr SE
- 8 Covey Rise Dr SE
- 1 Lionel Ct NE
- 4 Bridgeview Dr SE
- 12 Covey Rise Dr SE
- 13 Parkway Dr SE
- 11 Surrey Trail SE
- 0 Moran Lake Rd NE Unit 7676870
- 0 Moran Lake Rd NE Unit 229 10584708
- 0 Moran Lake Rd NE Unit 10637931
- 0 Moran Lake Rd NE Unit 10592848
- 11 N Ivy Ridge Rd SE
- 26 Ford Dr SE
- 30 Ford Dr SE
- 9 N Cloudview Rd SE
- 8 N Cloudview Rd SE
- 3 Elliott Dr SE
- 0 Elliott Dr SE
- 10 N Ivy Ridge Rd SE
- 61 Southfork Dr SW
- 57 Southfork Dr SW
- 60 Southfork Dr SW
- 9 N Ivy Ridge Rd SE
- 59 Southfork Dr SW
- 32 Ford Dr SE
- 22 Ford Rd SE
- 22 Ford Rd SE
- 58 Southfork Dr SW
- 8 N Ivy Ridge Rd SE
- 6 N Cloudview Rd SE
- N N Ivy Ridge Rd