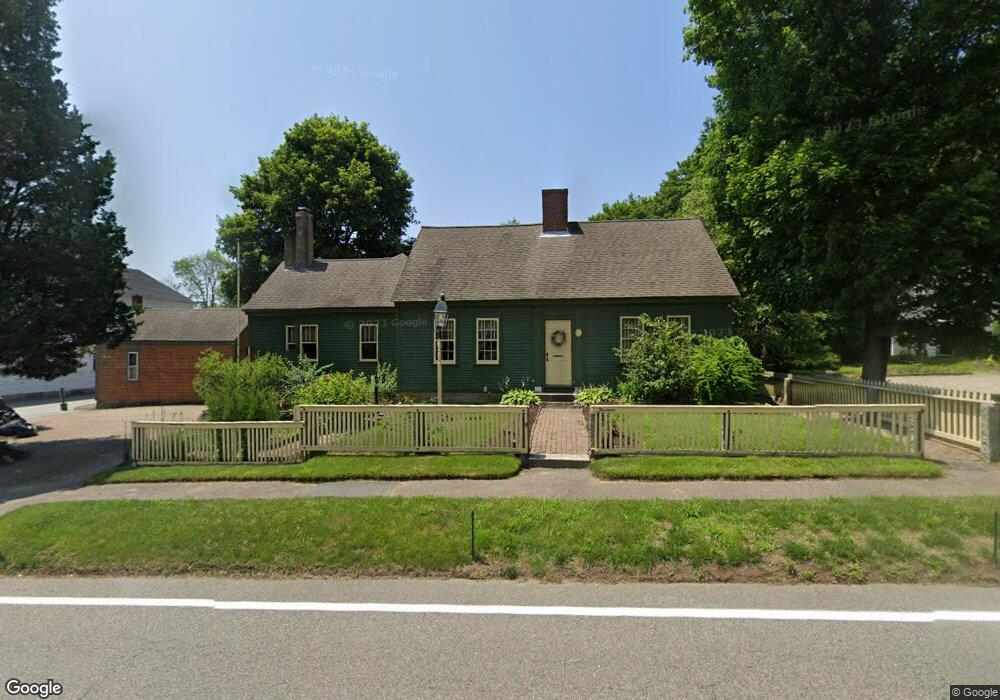
13 N Main St Assonet, MA 02702
Assonet NeighborhoodEstimated Value: $773,969
2
Beds
1
Bath
2,615
Sq Ft
$296/Sq Ft
Est. Value
About This Home
This home is located at 13 N Main St, Assonet, MA 02702 and is currently estimated at $773,969, approximately $295 per square foot. 13 N Main St is a home located in Bristol County with nearby schools including Freetown Elementary School, George R Austin Intermediate School, and Freetown-Lakeville Middle School.
Ownership History
Date
Name
Owned For
Owner Type
Purchase Details
Closed on
Sep 6, 2001
Sold by
Double Jj Rlty Inc
Bought by
Burke Rt
Current Estimated Value
Home Financials for this Owner
Home Financials are based on the most recent Mortgage that was taken out on this home.
Original Mortgage
$195,000
Interest Rate
7.05%
Mortgage Type
Commercial
Purchase Details
Closed on
Mar 24, 1980
Bought by
Ruest Samuel J
Create a Home Valuation Report for This Property
The Home Valuation Report is an in-depth analysis detailing your home's value as well as a comparison with similar homes in the area
Home Values in the Area
Average Home Value in this Area
Purchase History
| Date | Buyer | Sale Price | Title Company |
|---|---|---|---|
| Burke Rt | $255,000 | -- | |
| Ruest Samuel J | $42,000 | -- |
Source: Public Records
Mortgage History
| Date | Status | Borrower | Loan Amount |
|---|---|---|---|
| Open | Ruest Samuel J | $224,000 | |
| Closed | Ruest Samuel J | $195,000 | |
| Previous Owner | Ruest Samuel J | $130,000 |
Source: Public Records
Tax History Compared to Growth
Tax History
| Year | Tax Paid | Tax Assessment Tax Assessment Total Assessment is a certain percentage of the fair market value that is determined by local assessors to be the total taxable value of land and additions on the property. | Land | Improvement |
|---|---|---|---|---|
| 2025 | -- | $513,700 | $165,500 | $348,200 |
| 2024 | -- | $485,300 | $156,100 | $329,200 |
| 2023 | $0 | $459,600 | $140,600 | $319,000 |
| 2022 | $0 | $440,800 | $119,100 | $321,700 |
| 2021 | $6,284 | $376,200 | $108,300 | $267,900 |
| 2020 | $5,958 | $360,000 | $98,700 | $261,300 |
| 2019 | $5,602 | $333,300 | $94,000 | $239,300 |
| 2018 | $5,276 | $310,100 | $94,000 | $216,100 |
| 2017 | $0 | $300,700 | $94,000 | $206,700 |
| 2016 | -- | $302,200 | $101,400 | $200,800 |
| 2015 | -- | $298,600 | $101,400 | $197,200 |
| 2014 | -- | $293,000 | $99,300 | $193,700 |
Source: Public Records
Map
Nearby Homes
- 1 Elm St
- 5 Hadley Heights Way
- 16 Water St Unit A
- 16 Water St Unit C
- 16 Water St Unit B
- 16 Water St Unit D
- 4 Hadley Heights Way
- 37 Simpson Ln
- 22 Freemens Cir
- 20 Slab Bridge Rd
- 6 Weetamoe Dr
- 42 High St
- 17 E Public St
- 111 High St
- 0 Bayview Ave
- 125 Bayview Ave
- 35 Water St
- 22 Riverside Dr
- 3 Beach St
- 66 S Main St