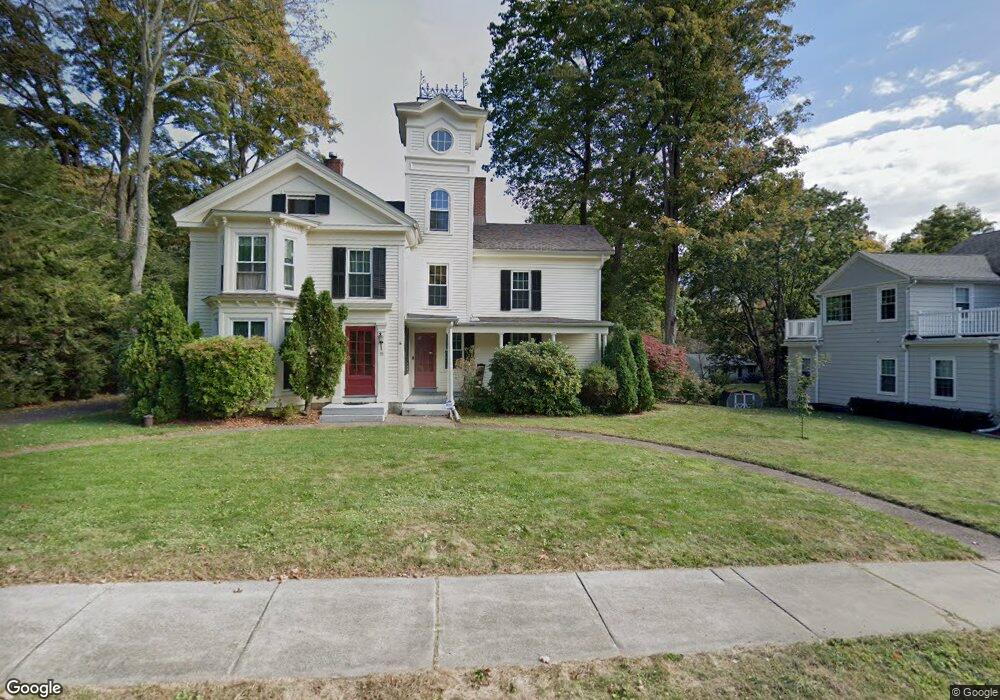
13 N Main St East Hampton, CT 06424
Estimated Value: $389,743
--
Bed
1
Bath
4,004
Sq Ft
$97/Sq Ft
Est. Value
About This Home
This home is located at 13 N Main St, East Hampton, CT 06424 and is currently priced at $389,743, approximately $97 per square foot. 13 N Main St is a home located in Middlesex County with nearby schools including Memorial School, Center Elementary School, and East Hampton Middle School.
Ownership History
Date
Name
Owned For
Owner Type
Purchase Details
Closed on
Feb 24, 2017
Sold by
Stove Prairie Props Ll
Bought by
13 North Main Llc
Current Estimated Value
Home Financials for this Owner
Home Financials are based on the most recent Mortgage that was taken out on this home.
Original Mortgage
$180,000
Outstanding Balance
$149,058
Interest Rate
4.12%
Mortgage Type
Commercial
Purchase Details
Closed on
Jan 23, 2007
Sold by
Cabinet Shoppe Llc
Bought by
Theater Square Llc
Home Financials for this Owner
Home Financials are based on the most recent Mortgage that was taken out on this home.
Original Mortgage
$1,200,000
Interest Rate
6.24%
Mortgage Type
Commercial
Purchase Details
Closed on
May 16, 2006
Sold by
Cabinet Shoppe Llc
Bought by
Stove Prairie Prop Llc
Purchase Details
Closed on
Jan 2, 2001
Sold by
Ostrager Murray
Bought by
Mizener William and Foss Bruce
Create a Home Valuation Report for This Property
The Home Valuation Report is an in-depth analysis detailing your home's value as well as a comparison with similar homes in the area
Home Values in the Area
Average Home Value in this Area
Purchase History
| Date | Buyer | Sale Price | Title Company |
|---|---|---|---|
| 13 North Main Llc | $225,000 | -- | |
| 13 North Main Llc | $225,000 | -- | |
| 13 North Main Llc | $225,000 | -- | |
| Theater Square Llc | $200,000 | -- | |
| Theater Square Llc | $200,000 | -- | |
| Stove Prairie Prop Llc | $350,000 | -- | |
| Stove Prairie Prop Llc | $350,000 | -- | |
| Mizener William | $425,000 | -- | |
| Mizener William | $425,000 | -- |
Source: Public Records
Mortgage History
| Date | Status | Borrower | Loan Amount |
|---|---|---|---|
| Open | 13 North Main Llc | $180,000 | |
| Closed | 13 North Main Llc | $180,000 | |
| Previous Owner | Mizener William | $1,200,000 |
Source: Public Records
Tax History Compared to Growth
Tax History
| Year | Tax Paid | Tax Assessment Tax Assessment Total Assessment is a certain percentage of the fair market value that is determined by local assessors to be the total taxable value of land and additions on the property. | Land | Improvement |
|---|---|---|---|---|
| 2025 | $9,982 | $251,380 | $91,710 | $159,670 |
| 2024 | $9,562 | $251,380 | $91,710 | $159,670 |
| 2023 | $9,065 | $251,380 | $91,710 | $159,670 |
| 2022 | $8,649 | $249,550 | $91,700 | $157,850 |
| 2021 | $8,617 | $249,550 | $91,700 | $157,850 |
| 2020 | $5,260 | $158,720 | $86,650 | $72,070 |
| 2019 | $5,260 | $158,720 | $86,650 | $72,070 |
| 2018 | $4,971 | $158,720 | $86,650 | $72,070 |
| 2017 | $4,968 | $158,610 | $86,650 | $71,960 |
| 2016 | $4,669 | $158,610 | $86,650 | $71,960 |
| 2015 | $4,740 | $170,610 | $96,050 | $74,560 |
| 2014 | $4,124 | $170,610 | $96,050 | $74,560 |
Source: Public Records
Map
Nearby Homes
- 27 N Main St
- 41 Mallard Cove
- 14 Main St
- 17 Bevin Blvd
- 22 Lakeview St
- 75 N Main St
- 1 Watrous St
- 4 Watrous St
- 18 Lake Blvd
- 29 Watrous St
- 85 N Main St Unit 117
- 10 Railroad Ave
- 11 Nutmeg Ln
- 36 Champion Hill Rd
- Homesite 10 Quinns Way
- 11 West St
- 23 Edgerton St
- 0 Island Unit 24106398
- 152 Main St
- 28 Childs Rd
- 13 N Main St Unit 2nd Flr
- 13 N Main St Unit 1st Flr Rear
- 13 N Main St Unit A
- 13 N Main St Unit C
- 11 N Main St
- 5 Hills Ave
- 0 N Main St Unit G698608
- 0 N Main St Unit G10062397
- 0 N Main St Unit G10062400
- 0 N Main St
- 0 N Main St Unit 170385032
- 0 N Main St Unit G10202961
- 17 N Main St
- 6 Hills Ave
- 11 Hills Ave
- 8 Hills Ave
- 4 N Main St
- 4 N Main St
- 20 N Main St
- 20 N Main St Unit N/A