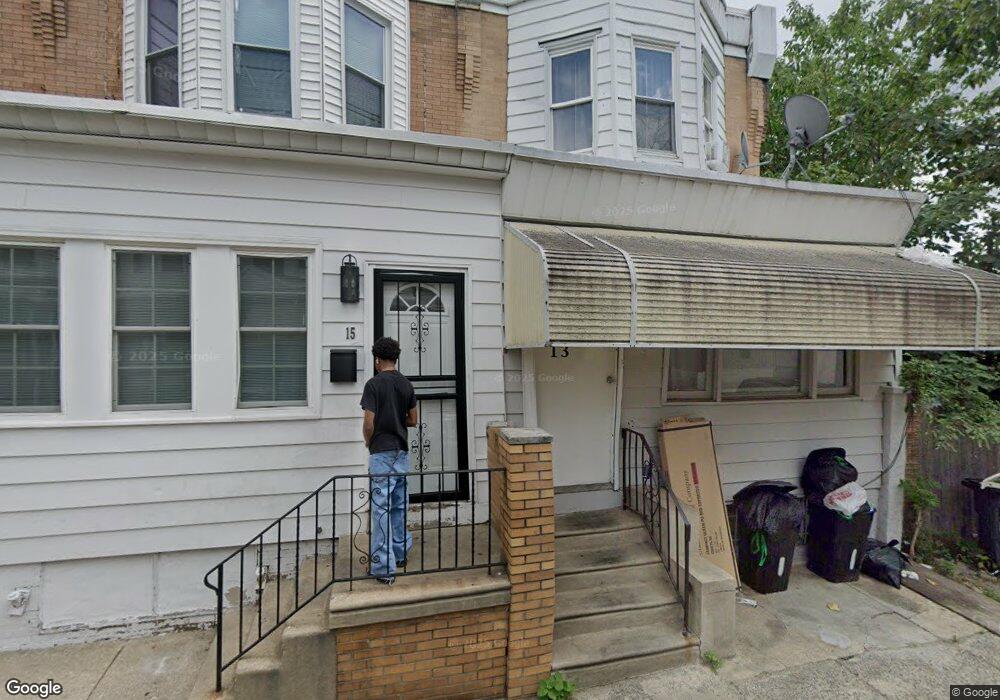
13 N Ruby St Philadelphia, PA 19139
Haddington NeighborhoodEstimated Value: $149,000 - $259,505
3
Beds
1
Bath
1,238
Sq Ft
$147/Sq Ft
Est. Value
About This Home
This home is located at 13 N Ruby St, Philadelphia, PA 19139 and is currently estimated at $181,876, approximately $146 per square foot. 13 N Ruby St is a home located in Philadelphia County with nearby schools including Alain Locke School, West Philadelphia High School, and Global Leadership Academy Charter School Southwest.
Ownership History
Date
Name
Owned For
Owner Type
Purchase Details
Closed on
Aug 28, 2020
Sold by
Harris Dorian
Bought by
Rodriguez Next Level Corp
Current Estimated Value
Purchase Details
Closed on
Aug 7, 2001
Sold by
Johnson Leon Bernard
Bought by
Harris Dorian
Purchase Details
Closed on
Apr 24, 2001
Sold by
Starkman Larry M
Bought by
Johnson Leon Bernard
Purchase Details
Closed on
Feb 26, 1998
Sold by
Postell Wilton and Postell Paul
Bought by
Starkman Larry M
Create a Home Valuation Report for This Property
The Home Valuation Report is an in-depth analysis detailing your home's value as well as a comparison with similar homes in the area
Home Values in the Area
Average Home Value in this Area
Purchase History
| Date | Buyer | Sale Price | Title Company |
|---|---|---|---|
| Rodriguez Next Level Corp | $35,000 | Golden Land Transfer Llc | |
| Harris Dorian | $24,000 | -- | |
| Johnson Leon Bernard | $10,000 | -- | |
| Starkman Larry M | $7,000 | -- |
Source: Public Records
Tax History Compared to Growth
Tax History
| Year | Tax Paid | Tax Assessment Tax Assessment Total Assessment is a certain percentage of the fair market value that is determined by local assessors to be the total taxable value of land and additions on the property. | Land | Improvement |
|---|---|---|---|---|
| 2026 | $1,061 | $102,200 | $20,440 | $81,760 |
| 2025 | $1,061 | $102,200 | $20,440 | $81,760 |
| 2024 | $1,061 | $102,200 | $20,440 | $81,760 |
| 2023 | $1,061 | $75,800 | $15,160 | $60,640 |
| 2022 | $754 | $75,800 | $15,160 | $60,640 |
| 2021 | $755 | $0 | $0 | $0 |
| 2020 | $755 | $0 | $0 | $0 |
| 2019 | $726 | $0 | $0 | $0 |
| 2018 | $615 | $0 | $0 | $0 |
| 2017 | $615 | $0 | $0 | $0 |
| 2016 | $615 | $0 | $0 | $0 |
| 2015 | $821 | $0 | $0 | $0 |
| 2014 | -- | $61,300 | $4,242 | $57,058 |
| 2012 | -- | $5,856 | $914 | $4,942 |
Source: Public Records
Map
Nearby Homes