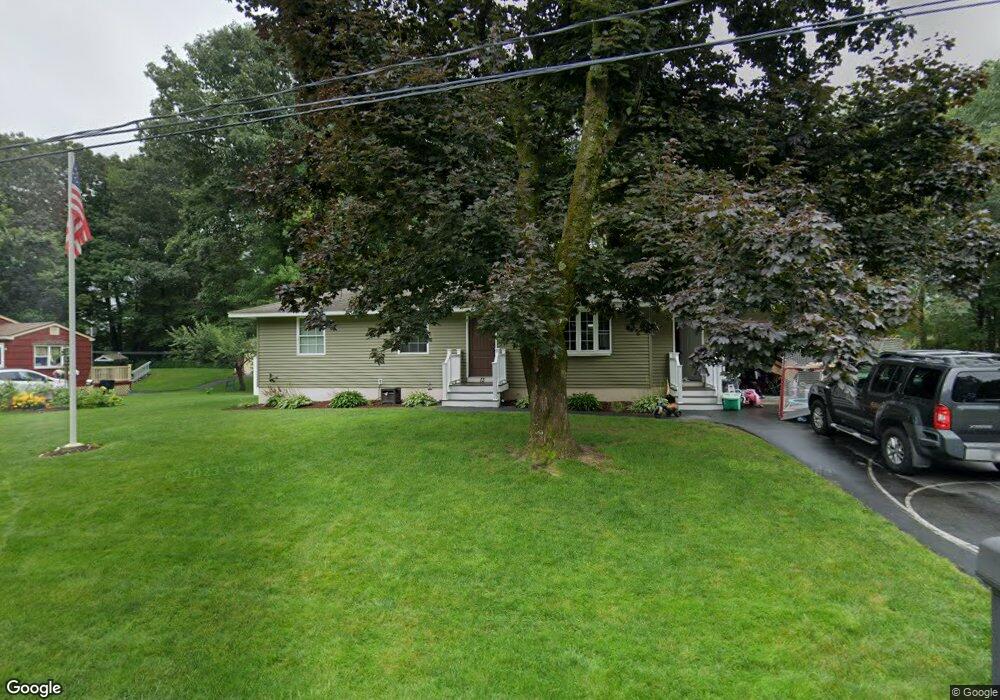
13 Nancy Dr Rutland, MA 01543
Estimated Value: $353,000 - $512,000
3
Beds
2
Baths
1,828
Sq Ft
$248/Sq Ft
Est. Value
About This Home
This home is located at 13 Nancy Dr, Rutland, MA 01543 and is currently estimated at $454,067, approximately $248 per square foot. 13 Nancy Dr is a home located in Worcester County with nearby schools including Wachusett Regional High School.
Ownership History
Date
Name
Owned For
Owner Type
Purchase Details
Closed on
Jun 30, 2005
Sold by
Clark Lisa F and Clark William M
Bought by
Ahlstrand Mathew and Devereaux Tracy
Current Estimated Value
Home Financials for this Owner
Home Financials are based on the most recent Mortgage that was taken out on this home.
Original Mortgage
$263,900
Outstanding Balance
$138,381
Interest Rate
5.73%
Mortgage Type
Purchase Money Mortgage
Estimated Equity
$315,686
Purchase Details
Closed on
Jul 31, 2000
Sold by
Barnes Donna F and Barnes Robert E
Bought by
Clark William M and Clark Lisa F
Home Financials for this Owner
Home Financials are based on the most recent Mortgage that was taken out on this home.
Original Mortgage
$124,800
Interest Rate
8.18%
Mortgage Type
Purchase Money Mortgage
Purchase Details
Closed on
Jul 15, 1997
Sold by
Campbell James W and Campbell Laurel
Bought by
Barnes Robert E and Barnes Donna F
Create a Home Valuation Report for This Property
The Home Valuation Report is an in-depth analysis detailing your home's value as well as a comparison with similar homes in the area
Home Values in the Area
Average Home Value in this Area
Purchase History
| Date | Buyer | Sale Price | Title Company |
|---|---|---|---|
| Ahlstrand Mathew | $263,900 | -- | |
| Clark William M | $156,000 | -- | |
| Barnes Robert E | $117,500 | -- |
Source: Public Records
Mortgage History
| Date | Status | Borrower | Loan Amount |
|---|---|---|---|
| Open | Ahlstrand Mathew | $263,900 | |
| Previous Owner | Barnes Robert E | $25,000 | |
| Previous Owner | Barnes Robert E | $132,000 | |
| Previous Owner | Barnes Robert E | $124,800 |
Source: Public Records
Tax History Compared to Growth
Tax History
| Year | Tax Paid | Tax Assessment Tax Assessment Total Assessment is a certain percentage of the fair market value that is determined by local assessors to be the total taxable value of land and additions on the property. | Land | Improvement |
|---|---|---|---|---|
| 2025 | $5,566 | $390,900 | $95,400 | $295,500 |
| 2024 | $5,167 | $348,400 | $85,600 | $262,800 |
| 2023 | $4,742 | $345,600 | $80,800 | $264,800 |
| 2022 | $4,625 | $292,900 | $68,400 | $224,500 |
| 2021 | $4,377 | $262,100 | $68,400 | $193,700 |
| 2020 | $4,188 | $237,800 | $64,300 | $173,500 |
| 2019 | $4,061 | $227,000 | $58,900 | $168,100 |
| 2018 | $3,916 | $216,000 | $58,900 | $157,100 |
| 2017 | $3,842 | $209,700 | $58,900 | $150,800 |
| 2016 | $3,526 | $203,000 | $59,000 | $144,000 |
| 2015 | $3,292 | $186,500 | $59,000 | $127,500 |
| 2014 | $3,191 | $186,500 | $59,000 | $127,500 |
Source: Public Records
Map
Nearby Homes
- 10 Beechwood Dr
- 21 Highland Park Rd
- 7 Prescott St
- 85 Maple Ave Unit A
- 27 Lewis St
- 11 Lewis St
- 21 Lewis St
- 12 Lewis St
- 6 Lewis St
- 2 Forest Hill Dr
- 28 Forest Hill Dr
- 132 Fidelity Dr Unit 61
- 10 Fidelity Dr Unit 5
- 176 Maple Ave Unit 1-38
- 176 Maple Ave Unit 3-25
- 176 Maple Ave Unit 2-26
- 189 Maple Ave
- 25 Watson Ln
- 2226 Main St
- 32 Pommogussett Rd Unit 1