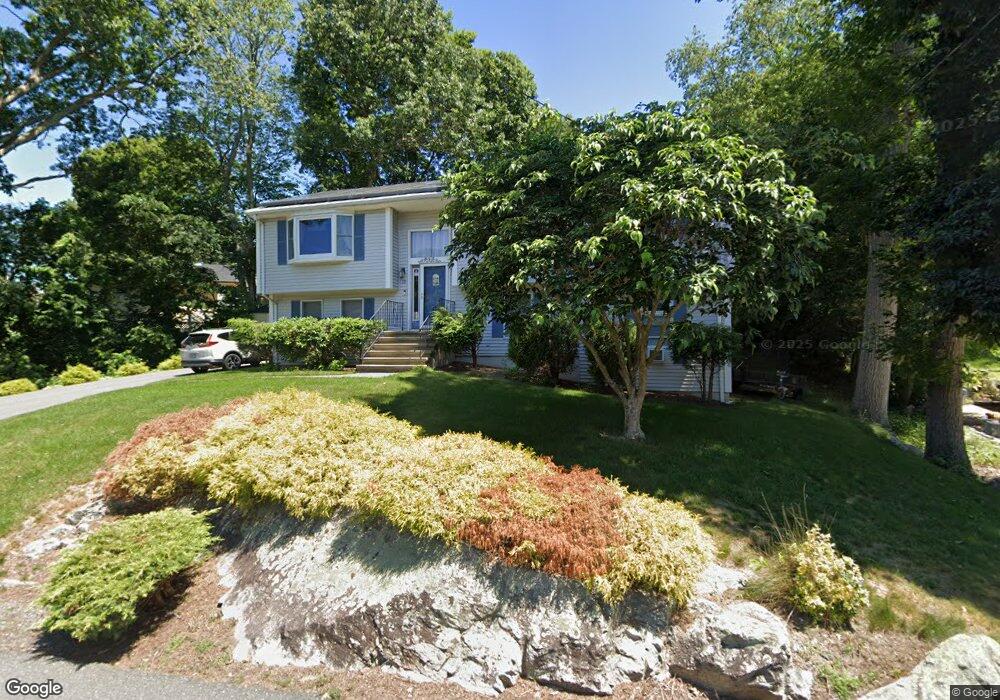
13 Oak Point Rd Saugus, MA 01906
Lynnhurst NeighborhoodEstimated Value: $829,272 - $934,000
3
Beds
2
Baths
2,530
Sq Ft
$354/Sq Ft
Est. Value
About This Home
This home is located at 13 Oak Point Rd, Saugus, MA 01906 and is currently estimated at $896,318, approximately $354 per square foot. 13 Oak Point Rd is a home located in Essex County with nearby schools including Saugus High School and Pioneer Charter School Of Science II.
Ownership History
Date
Name
Owned For
Owner Type
Purchase Details
Closed on
Nov 29, 2001
Sold by
Essery John W and Essery Donna A
Bought by
Loconte John and Loconte Loretta
Current Estimated Value
Purchase Details
Closed on
May 29, 1998
Sold by
Macrina Anthony J
Bought by
Essery Ii John W and Essery Donna A
Purchase Details
Closed on
Jul 6, 1995
Sold by
Lbk Rt and Susch Lloyd
Bought by
Macrina Anthony J
Create a Home Valuation Report for This Property
The Home Valuation Report is an in-depth analysis detailing your home's value as well as a comparison with similar homes in the area
Home Values in the Area
Average Home Value in this Area
Purchase History
| Date | Buyer | Sale Price | Title Company |
|---|---|---|---|
| Loconte John | $387,500 | -- | |
| Essery Ii John W | $247,900 | -- | |
| Macrina Anthony J | $215,000 | -- |
Source: Public Records
Mortgage History
| Date | Status | Borrower | Loan Amount |
|---|---|---|---|
| Open | Macrina Anthony J | $130,000 | |
| Closed | Macrina Anthony J | $139,500 | |
| Closed | Macrina Anthony J | $147,720 |
Source: Public Records
Tax History
| Year | Tax Paid | Tax Assessment Tax Assessment Total Assessment is a certain percentage of the fair market value that is determined by local assessors to be the total taxable value of land and additions on the property. | Land | Improvement |
|---|---|---|---|---|
| 2025 | $7,420 | $694,800 | $330,900 | $363,900 |
| 2024 | $7,115 | $668,100 | $312,000 | $356,100 |
| 2023 | $6,818 | $605,500 | $274,200 | $331,300 |
| 2022 | $6,664 | $554,900 | $251,500 | $303,400 |
| 2021 | $6,439 | $521,800 | $218,400 | $303,400 |
| 2020 | $5,992 | $502,700 | $208,000 | $294,700 |
| 2019 | $5,705 | $468,400 | $189,100 | $279,300 |
| 2018 | $5,230 | $451,600 | $183,400 | $268,200 |
| 2017 | $4,941 | $410,000 | $171,100 | $238,900 |
| 2016 | $5,043 | $413,400 | $170,900 | $242,500 |
| 2015 | $4,732 | $393,700 | $162,700 | $231,000 |
| 2014 | $4,127 | $355,500 | $162,700 | $192,800 |
Source: Public Records
Map
Nearby Homes
- 22 Susan Dr
- 29 Susan Dr
- 7 Nirvana Dr
- 24 Palmetto St
- 7 Central St
- 67 Saville St
- 22 Blueridge Ave
- 227 Walnut St
- 34 Summer St
- 5 Thomas St Unit 8
- 52 Hesper St
- 222 Walnut St
- 43 Taylor St
- 801 Sherwood Forest Ln
- 148 Forest St
- 921 Sherwood Forest Ln
- 27 Garfield Ave
- 36 Jasper St
- 25 Auburn St
- 43 W Sigourney St
Your Personal Tour Guide
Ask me questions while you tour the home.