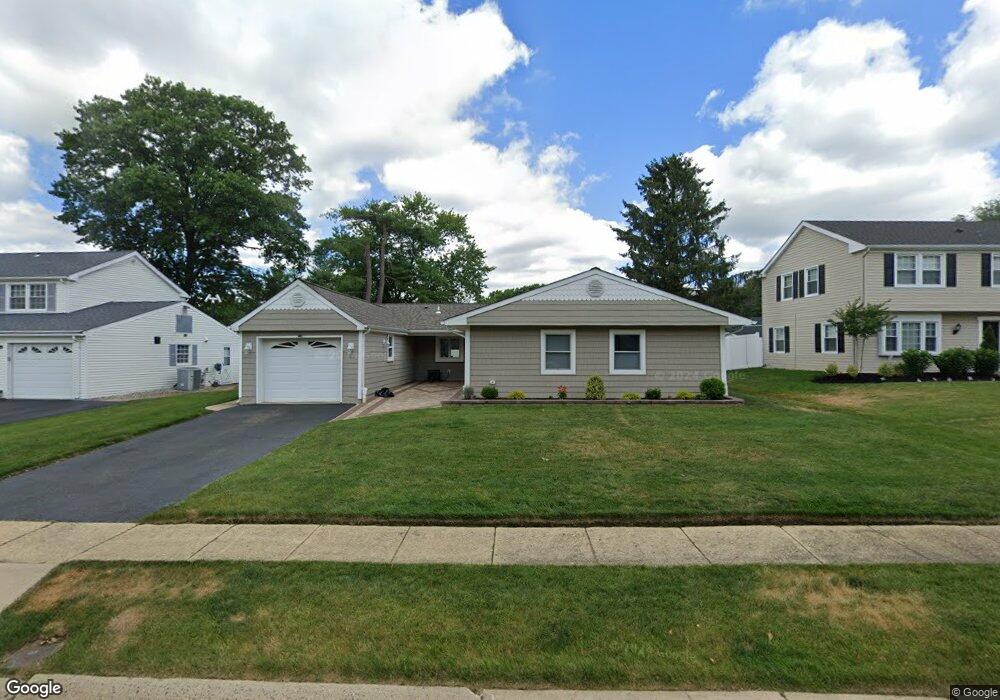
13 Ormont Ln Matawan, NJ 07747
Estimated Value: $636,000 - $667,000
3
Beds
2
Baths
1,795
Sq Ft
$364/Sq Ft
Est. Value
About This Home
This home is located at 13 Ormont Ln, Matawan, NJ 07747 and is currently estimated at $652,925, approximately $363 per square foot. 13 Ormont Ln is a home located in Monmouth County with nearby schools including Matawan Reg High School, St Benedict School, and Shalom Torah Academy.
Ownership History
Date
Name
Owned For
Owner Type
Purchase Details
Closed on
Aug 13, 2020
Sold by
Morgenstern Greg
Bought by
Lewandowski Brian
Current Estimated Value
Purchase Details
Closed on
Jun 28, 2007
Sold by
Oneill Keith F and Oneill Carol A
Bought by
Morgenstern Greg
Home Financials for this Owner
Home Financials are based on the most recent Mortgage that was taken out on this home.
Original Mortgage
$300,000
Interest Rate
6.39%
Mortgage Type
Stand Alone First
Purchase Details
Closed on
Jul 28, 1999
Sold by
Efrom Henry
Bought by
Oneill Keith and Oneill Carol
Home Financials for this Owner
Home Financials are based on the most recent Mortgage that was taken out on this home.
Original Mortgage
$169,850
Interest Rate
7.53%
Mortgage Type
FHA
Create a Home Valuation Report for This Property
The Home Valuation Report is an in-depth analysis detailing your home's value as well as a comparison with similar homes in the area
Home Values in the Area
Average Home Value in this Area
Purchase History
| Date | Buyer | Sale Price | Title Company |
|---|---|---|---|
| Lewandowski Brian | $385,000 | Professional Abstract & Ttl | |
| Morgenstern Greg | $375,000 | First American Title Ins Co | |
| Oneill Keith | $170,000 | -- |
Source: Public Records
Mortgage History
| Date | Status | Borrower | Loan Amount |
|---|---|---|---|
| Previous Owner | Morgenstern Greg | $300,000 | |
| Previous Owner | Oneill Keith | $169,850 |
Source: Public Records
Tax History
| Year | Tax Paid | Tax Assessment Tax Assessment Total Assessment is a certain percentage of the fair market value that is determined by local assessors to be the total taxable value of land and additions on the property. | Land | Improvement |
|---|---|---|---|---|
| 2025 | $11,291 | $630,900 | $429,800 | $201,100 |
| 2024 | $10,793 | $558,700 | $361,300 | $197,400 |
Source: Public Records
Map
Nearby Homes
- 244 Lloyd Rd
- 16 Fair Ln
- 28 Fayette Ln
- 9 Amherst Ct
- 114 Dundee Ct
- 532 Sloan Ct Unit 532
- 414 Sloan Ct
- 22 Shore Haven Park
- 39 W Aspen Way
- 326 Sloan Ct Unit 326
- 184 Edinburgh Ct Unit 184
- 160 Freneau Ave
- 293 Gloucester Ct
- 292 Gloucester Ct
- 283 Gloucester Ct
- 315 Wellington Place
- 537 S Atlantic Ave
- 104 Idolstone Ln
- 611 Wellington Place
- 323 Arlene Terrace
Your Personal Tour Guide
Ask me questions while you tour the home.