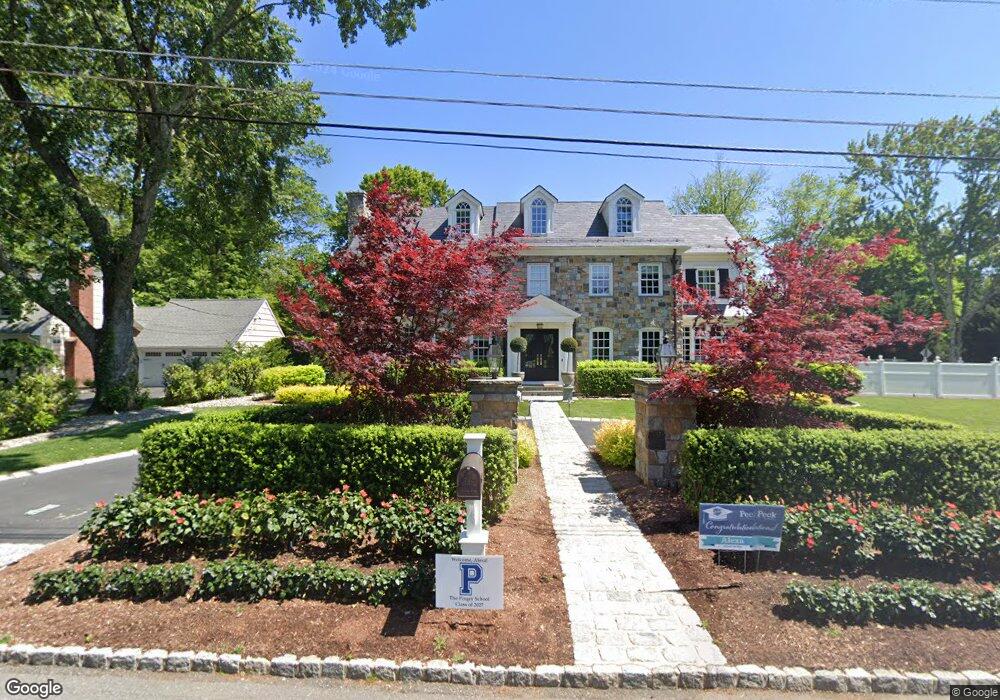
13 Overlook Rd Chatham Township, NJ 07928
Estimated Value: $3,504,000 - $4,051,000
--
Bed
--
Bath
6,296
Sq Ft
$594/Sq Ft
Est. Value
About This Home
This home is located at 13 Overlook Rd, Chatham Township, NJ 07928 and is currently estimated at $3,738,894, approximately $593 per square foot. 13 Overlook Rd is a home located in Morris County with nearby schools including Chatham High School, St. Patrick School, and Chatham Day School.
Ownership History
Date
Name
Owned For
Owner Type
Purchase Details
Closed on
Jun 9, 2017
Sold by
Golden River Homes Llc
Bought by
Cassanelli Joseph R and Cassanelli Tina M
Current Estimated Value
Home Financials for this Owner
Home Financials are based on the most recent Mortgage that was taken out on this home.
Original Mortgage
$250,000
Outstanding Balance
$192,184
Interest Rate
3.95%
Mortgage Type
Credit Line Revolving
Estimated Equity
$3,546,710
Purchase Details
Closed on
Jun 19, 2015
Sold by
Riker William W and Riker Anna M
Bought by
Golden River Homes Llc
Home Financials for this Owner
Home Financials are based on the most recent Mortgage that was taken out on this home.
Original Mortgage
$700,000
Interest Rate
8%
Mortgage Type
Purchase Money Mortgage
Purchase Details
Closed on
Sep 3, 2009
Sold by
Riker William W and Ferrara Louise R
Bought by
Riker William W and Ferrara Louise R
Create a Home Valuation Report for This Property
The Home Valuation Report is an in-depth analysis detailing your home's value as well as a comparison with similar homes in the area
Home Values in the Area
Average Home Value in this Area
Purchase History
| Date | Buyer | Sale Price | Title Company |
|---|---|---|---|
| Cassanelli Joseph R | $3,175,000 | Old Republic Natl Title Ins | |
| Golden River Homes Llc | $998,000 | Attorney | |
| Riker William W | -- | None Available |
Source: Public Records
Mortgage History
| Date | Status | Borrower | Loan Amount |
|---|---|---|---|
| Open | Cassanelli Joseph R | $250,000 | |
| Previous Owner | Golden River Homes Llc | $700,000 |
Source: Public Records
Tax History Compared to Growth
Tax History
| Year | Tax Paid | Tax Assessment Tax Assessment Total Assessment is a certain percentage of the fair market value that is determined by local assessors to be the total taxable value of land and additions on the property. | Land | Improvement |
|---|---|---|---|---|
| 2025 | $56,983 | $2,864,900 | $558,900 | $2,306,000 |
| 2024 | $56,037 | $2,864,900 | $558,900 | $2,306,000 |
| 2023 | $56,037 | $2,864,900 | $558,900 | $2,306,000 |
| 2022 | $55,321 | $2,864,900 | $558,900 | $2,306,000 |
| 2021 | $55,321 | $2,864,900 | $558,900 | $2,306,000 |
| 2020 | $54,233 | $2,864,900 | $558,900 | $2,306,000 |
| 2019 | $53,115 | $2,864,900 | $558,900 | $2,306,000 |
| 2018 | $52,514 | $2,864,900 | $558,900 | $2,306,000 |
| 2017 | $11,775 | $658,900 | $558,900 | $100,000 |
| 2016 | $9,831 | $558,900 | $558,900 | $0 |
| 2015 | $12,551 | $716,400 | $558,900 | $157,500 |
| 2014 | $12,451 | $716,400 | $558,900 | $157,500 |
Source: Public Records
Map
Nearby Homes