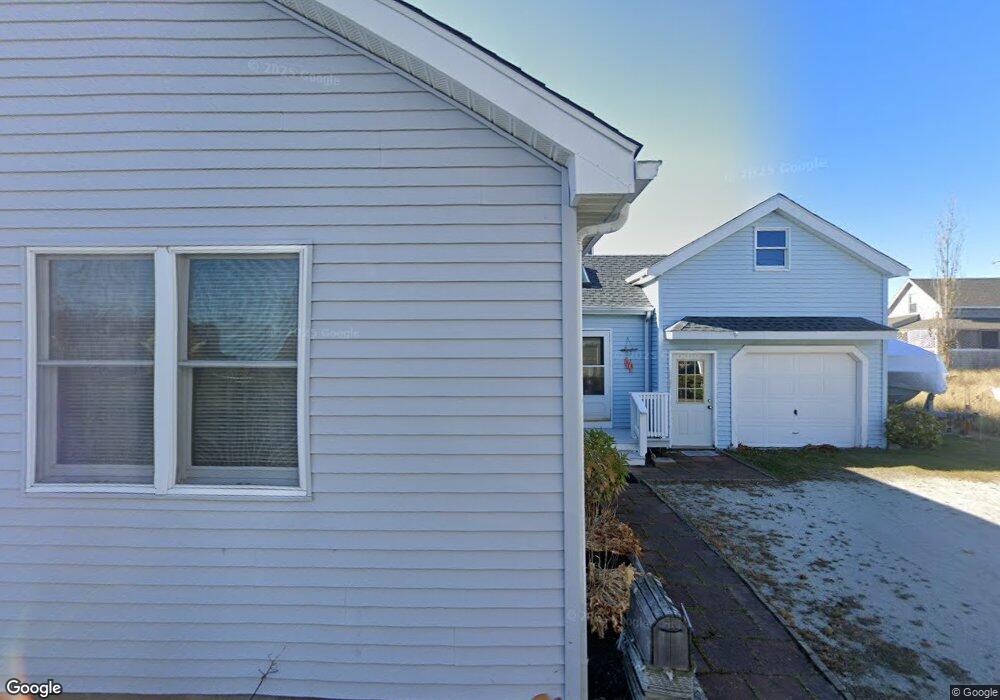
13 Overlook St Newburyport, MA 01950
Estimated Value: $724,000 - $1,147,000
3
Beds
2
Baths
1,305
Sq Ft
$710/Sq Ft
Est. Value
About This Home
This home is located at 13 Overlook St, Newburyport, MA 01950 and is currently estimated at $926,588, approximately $710 per square foot. 13 Overlook St is a home located in Essex County with nearby schools including Francis T. Bresnahan Elementary School, Edward G. Molin Elementary School, and Rupert A. Nock Middle School.
Ownership History
Date
Name
Owned For
Owner Type
Purchase Details
Closed on
Mar 10, 2025
Sold by
Mccoy Cheryl A and Mccoy Richard P
Bought by
Mccoy Ft and Mccoy
Current Estimated Value
Purchase Details
Closed on
Feb 20, 2018
Sold by
Mccoy Catherine M and Mccoy Stephen M
Bought by
Mccoy Cheryl A and Mccoy Richard P
Home Financials for this Owner
Home Financials are based on the most recent Mortgage that was taken out on this home.
Original Mortgage
$285,000
Interest Rate
3.38%
Mortgage Type
New Conventional
Create a Home Valuation Report for This Property
The Home Valuation Report is an in-depth analysis detailing your home's value as well as a comparison with similar homes in the area
Home Values in the Area
Average Home Value in this Area
Purchase History
| Date | Buyer | Sale Price | Title Company |
|---|---|---|---|
| Mccoy Ft | -- | None Available | |
| Mccoy Ft | -- | None Available | |
| Mccoy Ft | -- | None Available | |
| Mccoy Cheryl A | $380,000 | -- | |
| Mccoy Cheryl A | $380,000 | -- | |
| Mccoy Cheryl A | $380,000 | -- |
Source: Public Records
Mortgage History
| Date | Status | Borrower | Loan Amount |
|---|---|---|---|
| Previous Owner | Mccoy Cheryl A | $285,000 |
Source: Public Records
Tax History Compared to Growth
Tax History
| Year | Tax Paid | Tax Assessment Tax Assessment Total Assessment is a certain percentage of the fair market value that is determined by local assessors to be the total taxable value of land and additions on the property. | Land | Improvement |
|---|---|---|---|---|
| 2025 | $7,431 | $775,700 | $456,200 | $319,500 |
| 2024 | $7,200 | $722,200 | $414,700 | $307,500 |
| 2023 | $6,320 | $588,500 | $329,100 | $259,400 |
| 2022 | $5,867 | $488,500 | $274,200 | $214,300 |
| 2021 | $5,802 | $459,000 | $271,000 | $188,000 |
| 2020 | $5,739 | $447,000 | $271,000 | $176,000 |
| 2019 | $5,481 | $419,000 | $260,200 | $158,800 |
| 2018 | $5,352 | $403,600 | $247,800 | $155,800 |
| 2017 | $5,270 | $391,800 | $236,000 | $155,800 |
| 2016 | $5,182 | $387,000 | $234,100 | $152,900 |
| 2015 | $4,977 | $373,100 | $234,100 | $139,000 |
Source: Public Records
Map
Nearby Homes
- 11 Harbor St
- 12 Barker St
- 4 54th St
- 12 53rd St
- 5 Helena St
- 44 Old Point Rd
- 10 Meadowview Ln Unit B
- 5 Northern Blvd
- 2 Plum Island Blvd
- 11 Sunset Dr
- 2 Sunset Dr
- 28 & 30 Plum Island Turnpike
- 65 Plum Island Turnpike
- 141 Atlantic Ave
- 116 Railroad Ave
- 114 Railroad Ave
- 52 Brissette Ave
- 103 Railroad Ave
- 20 Cable Ave Unit 11
- 33 Union St