NOT LISTED FOR SALE

Estimated Value: $235,000 - $266,000

3 Beds
2 Baths
1,032 Sq Ft
$244/Sq Ft Est. Value

Last Sold December 21, 2021

Last sale price $178,000 $172 Per Sq Ft

Est. 42% increase in value since last sale

Current estimated payment $1,547/month

About This Home

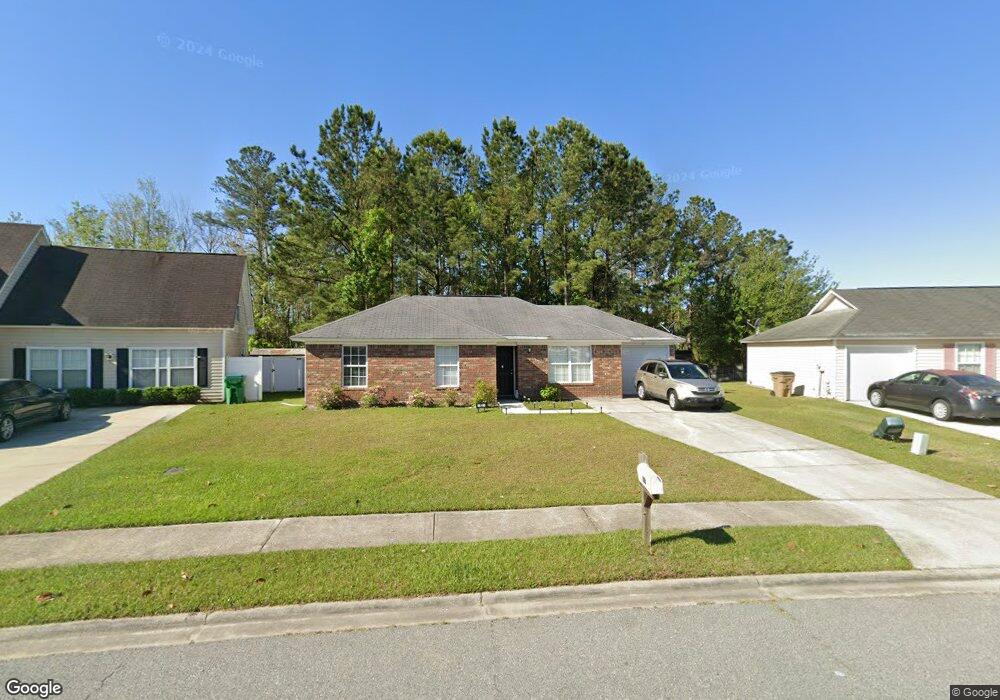
BACK ON THE MARKET AT NO FAULT OF THE SELLER!
Looking for a home that is convenient to Pooler & Savannah? Here it is! Cute 3 bedroom, 2 bath with fresh paint, new carpet in bedrooms and new LVT flooring in all common areas, brand new stainless steel dishwasher and stove. NO HOA! Come take a look!

Ownership History

Date Name Owned For Owner Type

Purchase Details

Closed on
Dec 21, 2021
Sold by
Tmrp Properties Llc
Bought by
Howard Sonya D
Current Estimated Value
$252,218

Home Financials for this Owner

Home Financials are based on the most recent Mortgage that was taken out on this home.
Original Mortgage
$179,797
Outstanding Balance
$165,388
Interest Rate
3.12%
Mortgage Type
New Conventional
Estimated Equity
$86,830

Purchase Details

Closed on
Jun 1, 2016
Sold by
Palumbo Teresa
Bought by
T M R P Properties Llc

Purchase Details

Closed on
Sep 15, 2004
Sold by
Hayes James D
Bought by
Palumbo Teresa
Source: Public Records

Range of Values:

--
Value Increase
--
Percent Increase
--
Adjusted for Inflation
Collateral Analytics

Collateral Analytics Collateral Analytics AVMs (Automated Valuation Model) employ a number of statistical approaches combined with neighborhood-specific comparable selection guarantees the most up-to-date and precise valuations.

Not Available

Collateral Analytics does not have data for the current month. Please view the chart for historical values.

ICE

ICE Mortgage Technology ICE Mortgage Technology’s AVM (Automated Valuation Model) is a state-of-the-art online residential property valuation tool that provides a quick and accurate estimate of the value of almost any home in the U.S.

Not Available

ICE Mortgage Technology does not have data for the current month. Please view the chart for historical values.

First American

First American First American Data & Analytics’ next-generation AVM combines unrivaled data assets with a blended ensemble of valuation models to produce highly accurate, reliable valuations you can trust.

Not Available

First American does not have data for the current month. Please view the chart for historical values.

Quantarium

Quantarium Quantarium’s valuation service, repeatedly proven the industry’s most accurate and comprehensive, is supercharged with a self-learning and auto-tuning AI engine that continually becomes smarter and more accurate as it processes daily inputs from the industry’s leading RE data lake.

Not Available

Quantarium does not have data for the current month. Please view the chart for historical values.

Average Value
Not Available
List Price
Sold Price
Create a Home Valuation Report for This Property
The Home Valuation Report is an in-depth analysis detailing your home's value as well as a comparison with similar homes in the area

Home Values in the Area

Source: Public Records

Average Home Value in this Area


Source: Public Records

Purchase History

Date Buyer Sale Price Title Company
Howard Sonya D $178,000 --
T M R P Properties Llc -- --
Palumbo Teresa $79,000 --
Source: Public Records

Mortgage History

Date Status Borrower Loan Amount
Open Howard Sonya D $179,797
Source: Public Records

Property History

Date Event Price List to Sale Price per Sq Ft Prior Sale
12/21/2021 12/21/21 Sold $178,000 +2.9% $172 / Sq Ft View Prior Sale
10/26/2021 10/26/21 Pending -- -- --
10/12/2021 10/12/21 For Sale $173,000 -- $168 / Sq Ft

Tax History Compared to Growth

Source: Public Records

Tax History

Year Tax Paid Tax Assessment Tax Assessment Total Assessment is a certain percentage of the fair market value that is determined by local assessors to be the total taxable value of land and additions on the property. Land Improvement
2025 $2,658 $86,000 $18,000 $68,000
2024 $2,658 $78,400 $18,000 $60,400
2023 $2,937 $83,840 $18,000 $65,840
2022 $1,721 $64,080 $8,600 $55,480
2021 $1,835 $48,320 $8,600 $39,720
2020 $1,662 $47,160 $8,600 $38,560
2019 $1,773 $45,560 $8,600 $36,960
2018 $1,397 $44,160 $8,600 $35,560
2017 $1,368 $41,520 $8,600 $32,920
2016 $1,437 $41,080 $8,600 $32,480
2015 $1,453 $41,480 $8,600 $32,880
2014 $2,120 $41,880 $0 $0
Source: Public Records

Agents Affiliated with this Home

  • Section Image
  • Section Image
See All Agents

Map