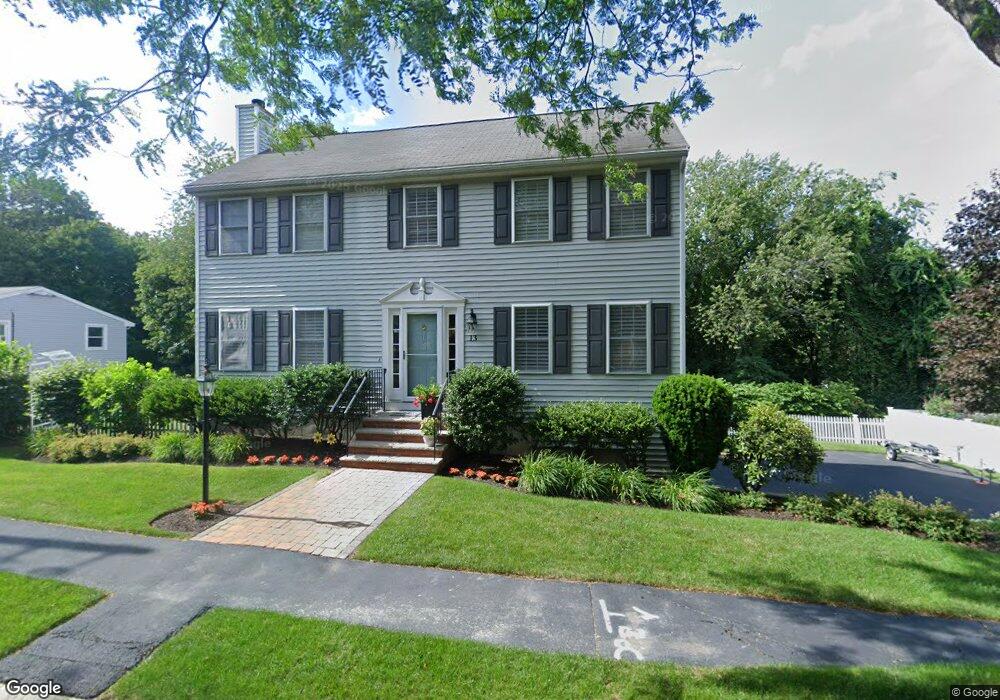
13 Patton Rd Salem, MA 01970
South Salem NeighborhoodEstimated Value: $817,000 - $894,000
3
Beds
3
Baths
2,340
Sq Ft
$364/Sq Ft
Est. Value
About This Home
This home is located at 13 Patton Rd, Salem, MA 01970 and is currently estimated at $850,730, approximately $363 per square foot. 13 Patton Rd is a home located in Essex County with nearby schools including Saltonstall School, Horace Mann Laboratory, and Witchcraft Heights Elementary School.
Ownership History
Date
Name
Owned For
Owner Type
Purchase Details
Closed on
May 5, 2000
Sold by
Vincent Dibiase Inc
Bought by
Mckeon John and Mckeon Leila
Current Estimated Value
Create a Home Valuation Report for This Property
The Home Valuation Report is an in-depth analysis detailing your home's value as well as a comparison with similar homes in the area
Home Values in the Area
Average Home Value in this Area
Purchase History
| Date | Buyer | Sale Price | Title Company |
|---|---|---|---|
| Mckeon John | $279,900 | -- |
Source: Public Records
Mortgage History
| Date | Status | Borrower | Loan Amount |
|---|---|---|---|
| Open | Mckeon John | $250,000 | |
| Closed | Mckeon John | $73,500 |
Source: Public Records
Tax History
| Year | Tax Paid | Tax Assessment Tax Assessment Total Assessment is a certain percentage of the fair market value that is determined by local assessors to be the total taxable value of land and additions on the property. | Land | Improvement |
|---|---|---|---|---|
| 2025 | $9,040 | $797,200 | $266,700 | $530,500 |
| 2024 | $8,816 | $758,700 | $251,700 | $507,000 |
| 2023 | $8,519 | $681,000 | $229,200 | $451,800 |
| 2022 | $8,073 | $609,300 | $210,400 | $398,900 |
| 2021 | $8,070 | $584,800 | $195,400 | $389,400 |
| 2020 | $7,855 | $543,600 | $191,700 | $351,900 |
| 2019 | $7,696 | $509,700 | $180,400 | $329,300 |
| 2018 | $7,435 | $483,400 | $168,400 | $315,000 |
| 2017 | $7,074 | $446,000 | $157,900 | $288,100 |
| 2016 | $6,920 | $441,600 | $157,900 | $283,700 |
| 2015 | $6,767 | $412,400 | $139,200 | $273,200 |
Source: Public Records
Map
Nearby Homes
- 34 Moffatt Rd
- 28 Surrey Rd
- 23 Marion Rd Unit B
- 106 Broadway Unit 3
- 6 Loring Hills Ave Unit D3
- 263 Jefferson Ave
- 11 Angenica Terrace
- 6 Arthur St Unit 3
- 259 Jefferson Ave
- 24 Wisteria St Unit 2
- 29 Willson St
- 326 Lafayette St Unit 2
- 49 Weatherly Dr
- 30 Weatherly Dr
- 11 Weatherly Dr
- 1002 Paradise Rd Unit PHE
- 25 Tedesco St
- 29 Ocean Ave Unit 4
- 212 Humphrey St Unit 205
- 1 Shore Ave
Your Personal Tour Guide
Ask me questions while you tour the home.