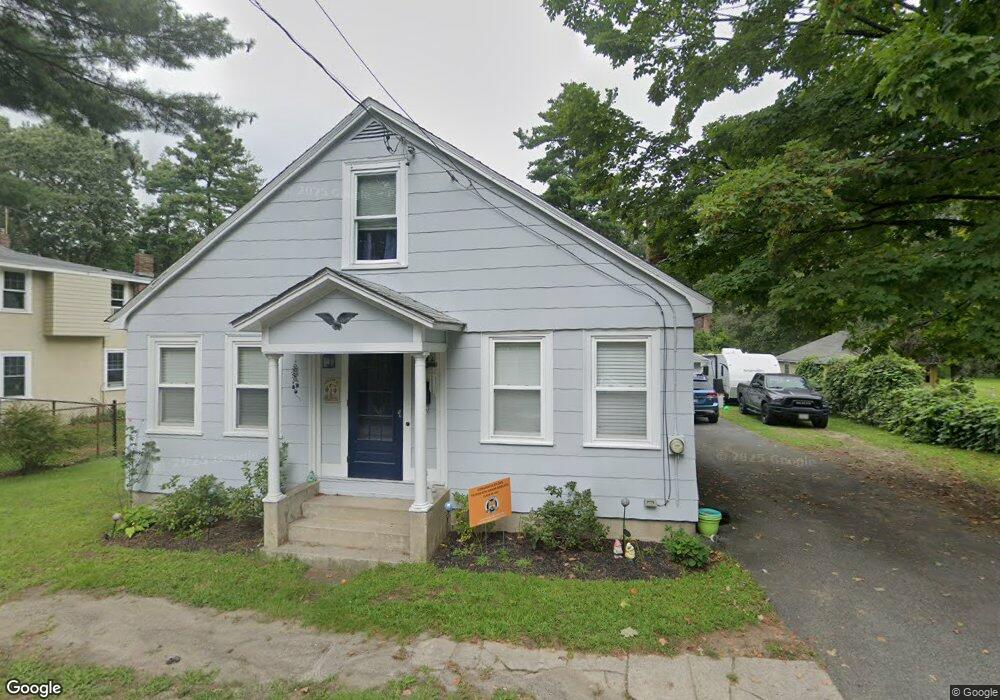
13 Perry Rd Natick, MA 01760
Estimated Value: $643,000 - $794,000
3
Beds
1
Bath
1,269
Sq Ft
$553/Sq Ft
Est. Value
About This Home
This home is located at 13 Perry Rd, Natick, MA 01760 and is currently estimated at $702,121, approximately $553 per square foot. 13 Perry Rd is a home located in Middlesex County with nearby schools including Natick High School, Wilson Middle School, and Bennett-Hemenway (Ben-Hem) Elementary School.
Ownership History
Date
Name
Owned For
Owner Type
Purchase Details
Closed on
Dec 15, 2017
Sold by
William J Pineau Ft and Pineau
Bought by
Pineau Joseph W and Pineau Megan C
Current Estimated Value
Home Financials for this Owner
Home Financials are based on the most recent Mortgage that was taken out on this home.
Original Mortgage
$292,000
Outstanding Balance
$245,621
Interest Rate
3.94%
Mortgage Type
New Conventional
Estimated Equity
$456,500
Purchase Details
Closed on
Feb 17, 2012
Sold by
Pineau William J
Bought by
William J Pineau Ft and Pineau
Create a Home Valuation Report for This Property
The Home Valuation Report is an in-depth analysis detailing your home's value as well as a comparison with similar homes in the area
Home Values in the Area
Average Home Value in this Area
Purchase History
| Date | Buyer | Sale Price | Title Company |
|---|---|---|---|
| Pineau Joseph W | $365,000 | -- | |
| William J Pineau Ft | -- | -- | |
| William J Pineau Ft | -- | -- |
Source: Public Records
Mortgage History
| Date | Status | Borrower | Loan Amount |
|---|---|---|---|
| Open | Pineau Joseph W | $292,000 |
Source: Public Records
Tax History
| Year | Tax Paid | Tax Assessment Tax Assessment Total Assessment is a certain percentage of the fair market value that is determined by local assessors to be the total taxable value of land and additions on the property. | Land | Improvement |
|---|---|---|---|---|
| 2025 | $6,479 | $541,700 | $431,800 | $109,900 |
| 2024 | $6,234 | $508,500 | $406,400 | $102,100 |
| 2023 | $6,151 | $486,600 | $390,500 | $96,100 |
| 2022 | $5,900 | $442,300 | $354,500 | $87,800 |
| 2021 | $5,874 | $431,600 | $334,200 | $97,400 |
| 2020 | $5,865 | $430,900 | $319,000 | $111,900 |
| 2019 | $5,477 | $430,900 | $319,000 | $111,900 |
| 2018 | $4,926 | $377,500 | $303,800 | $73,700 |
| 2017 | $4,553 | $337,500 | $259,800 | $77,700 |
| 2016 | $4,205 | $309,900 | $238,800 | $71,100 |
| 2015 | $4,204 | $304,200 | $238,800 | $65,400 |
Source: Public Records
Map
Nearby Homes
- 50 Wethersfield Rd
- 293 Bacon St Unit A
- 7 Jackson Ct Unit B
- 4 Richard Rd
- 1 Richard Rd
- 25 Irving Rd
- 29 Irving Rd
- 27 2nd St
- 5 Griffin Cir
- 83 Felch Rd
- 2 Darby Ct
- 136 Commonwealth Rd
- 8 Liberty St
- 41 Charles St
- 40 Nouvelle Way Unit 441
- 44 Harwood Rd
- 16 Arlington Rd
- 36 Winnemay St
- 45 W Plain St Unit 1
- 37 Longfellow Rd
Your Personal Tour Guide
Ask me questions while you tour the home.