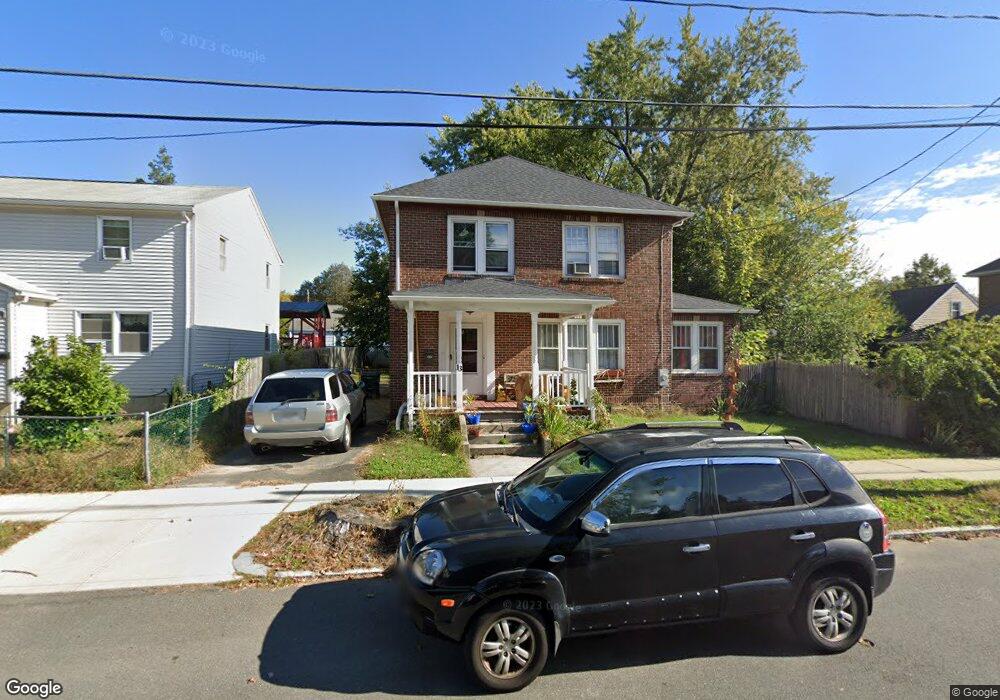
13 Piedmont St Springfield, MA 01104
Liberty Heights NeighborhoodEstimated Value: $235,000 - $300,091
3
Beds
2
Baths
1,652
Sq Ft
$163/Sq Ft
Est. Value
About This Home
This home is located at 13 Piedmont St, Springfield, MA 01104 and is currently estimated at $269,023, approximately $162 per square foot. 13 Piedmont St is a home located in Hampden County with nearby schools including Mary O. Pottenger Elementary School, Van Sickle Academy, and Springfield Central High School.
Ownership History
Date
Name
Owned For
Owner Type
Purchase Details
Closed on
Mar 16, 2009
Sold by
Us Bk
Bought by
Suarez Angel
Current Estimated Value
Home Financials for this Owner
Home Financials are based on the most recent Mortgage that was taken out on this home.
Original Mortgage
$77,330
Outstanding Balance
$49,302
Interest Rate
5.18%
Mortgage Type
Purchase Money Mortgage
Estimated Equity
$219,721
Purchase Details
Closed on
Mar 24, 2008
Sold by
Cuello Maria and Us Bk
Bought by
Us Bk
Purchase Details
Closed on
Sep 17, 2004
Sold by
Macphail Penelope S and Macphail Richard N
Bought by
Cuello Maria
Home Financials for this Owner
Home Financials are based on the most recent Mortgage that was taken out on this home.
Original Mortgage
$76,500
Interest Rate
6.02%
Mortgage Type
Purchase Money Mortgage
Create a Home Valuation Report for This Property
The Home Valuation Report is an in-depth analysis detailing your home's value as well as a comparison with similar homes in the area
Home Values in the Area
Average Home Value in this Area
Purchase History
| Date | Buyer | Sale Price | Title Company |
|---|---|---|---|
| Suarez Angel | $80,000 | -- | |
| Us Bk | $140,644 | -- | |
| Cuello Maria | $85,000 | -- |
Source: Public Records
Mortgage History
| Date | Status | Borrower | Loan Amount |
|---|---|---|---|
| Open | Suarez Angel | $77,330 | |
| Previous Owner | Cuello Maria | $76,500 |
Source: Public Records
Tax History
| Year | Tax Paid | Tax Assessment Tax Assessment Total Assessment is a certain percentage of the fair market value that is determined by local assessors to be the total taxable value of land and additions on the property. | Land | Improvement |
|---|---|---|---|---|
| 2025 | $4,372 | $278,800 | $37,200 | $241,600 |
| 2024 | $3,935 | $245,000 | $37,200 | $207,800 |
| 2023 | $3,686 | $216,200 | $32,900 | $183,300 |
| 2022 | $3,640 | $193,400 | $30,800 | $162,600 |
| 2021 | $3,470 | $183,600 | $28,000 | $155,600 |
| 2020 | $3,174 | $162,500 | $28,000 | $134,500 |
| 2019 | $3,214 | $163,300 | $30,500 | $132,800 |
| 2018 | $3,050 | $155,000 | $30,500 | $124,500 |
| 2017 | $3,016 | $153,400 | $27,600 | $125,800 |
| 2016 | $2,788 | $141,800 | $26,100 | $115,700 |
| 2015 | $2,758 | $140,200 | $26,100 | $114,100 |
Source: Public Records
Map
Nearby Homes
- 59 Piedmont St
- 49 Upland St
- 150 Drexel St
- 44 Border St
- 79-81 Windermere St
- 73 Melville
- 47 Victoria St
- 151 Littleton St
- 83 Oklahoma St
- 143 Saint James Cir
- 78 San Miguel St
- 1078 Liberty St
- 47 Holy Cross St
- 809 Carew St
- 882-884 Liberty St
- 797 Carew St
- 74 David St
- 744-746 Carew St
- 38 Tyrone St
- 774-776 Liberty St