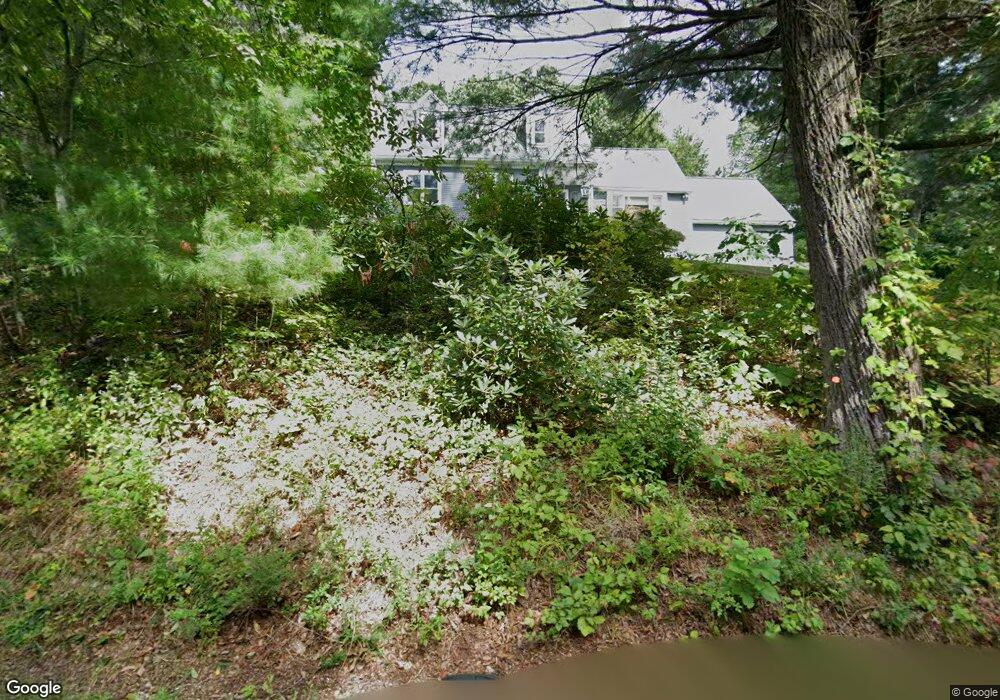
13 Pierce St Pepperell, MA 01463
Estimated Value: $657,230 - $759,000
3
Beds
3
Baths
2,329
Sq Ft
$301/Sq Ft
Est. Value
About This Home
This home is located at 13 Pierce St, Pepperell, MA 01463 and is currently estimated at $700,058, approximately $300 per square foot. 13 Pierce St is a home located in Middlesex County with nearby schools including North Middlesex Regional High School, Pepperell Christian Academy, and 2nd Nature Academy.
Ownership History
Date
Name
Owned For
Owner Type
Purchase Details
Closed on
Dec 2, 2022
Sold by
Cate Robert J and Cate Annette M
Bought by
Thirteen Pierce Street Rt
Current Estimated Value
Purchase Details
Closed on
May 31, 2002
Sold by
Murch Robert A and Murch Ellen M
Bought by
Cate Robert J and Cate Annette M
Home Financials for this Owner
Home Financials are based on the most recent Mortgage that was taken out on this home.
Original Mortgage
$200,000
Interest Rate
7%
Mortgage Type
Purchase Money Mortgage
Purchase Details
Closed on
Jun 23, 1992
Sold by
Esterbrook Rt
Bought by
Murch Robert A and Browne Ellen
Home Financials for this Owner
Home Financials are based on the most recent Mortgage that was taken out on this home.
Original Mortgage
$130,000
Interest Rate
8.67%
Mortgage Type
Purchase Money Mortgage
Create a Home Valuation Report for This Property
The Home Valuation Report is an in-depth analysis detailing your home's value as well as a comparison with similar homes in the area
Home Values in the Area
Average Home Value in this Area
Purchase History
| Date | Buyer | Sale Price | Title Company |
|---|---|---|---|
| Thirteen Pierce Street Rt | -- | None Available | |
| Cate Robert J | $345,000 | -- | |
| Murch Robert A | $173,265 | -- |
Source: Public Records
Mortgage History
| Date | Status | Borrower | Loan Amount |
|---|---|---|---|
| Previous Owner | Murch Robert A | $198,000 | |
| Previous Owner | Cate Robert J | $200,000 | |
| Previous Owner | Murch Robert A | $130,000 |
Source: Public Records
Tax History
| Year | Tax Paid | Tax Assessment Tax Assessment Total Assessment is a certain percentage of the fair market value that is determined by local assessors to be the total taxable value of land and additions on the property. | Land | Improvement |
|---|---|---|---|---|
| 2025 | $8,364 | $571,700 | $187,700 | $384,000 |
| 2024 | $7,984 | $556,400 | $172,400 | $384,000 |
| 2023 | $7,488 | $494,600 | $134,400 | $360,200 |
| 2022 | $7,579 | $441,900 | $122,700 | $319,200 |
| 2021 | $8,991 | $421,000 | $107,500 | $313,500 |
| 2020 | $4,108 | $426,000 | $107,500 | $318,500 |
| 2019 | $6,288 | $379,000 | $107,500 | $271,500 |
| 2018 | $5,966 | $364,000 | $107,500 | $256,500 |
| 2017 | $5,709 | $359,300 | $107,500 | $251,800 |
| 2016 | $5,442 | $329,200 | $107,500 | $221,700 |
| 2015 | $5,372 | $336,800 | $115,100 | $221,700 |
| 2014 | $4,886 | $308,100 | $107,500 | $200,600 |
Source: Public Records
Map
Nearby Homes
- 24 Dow St
- 27 Merrimac Dr
- 17 Merrimac Dr
- 8 Casie Ln
- 77 Birchwood Dr
- 12 Unkety Brook Way
- 11 Unkety Brook Way
- 4 Southgate Rd
- 3 Absalom Ln
- 14 Brookline St
- 39 Hollis St Unit A
- 28-30 Groton St
- 38 Tarbell St Unit 1D
- 72 Main St
- 29 Tarbell St
- 194 Dow Rd
- 98 Dow Rd
- 58 Lowell Rd
- 6 Testament Cir Unit 5
- 1 Dalkeith Rd
Your Personal Tour Guide
Ask me questions while you tour the home.