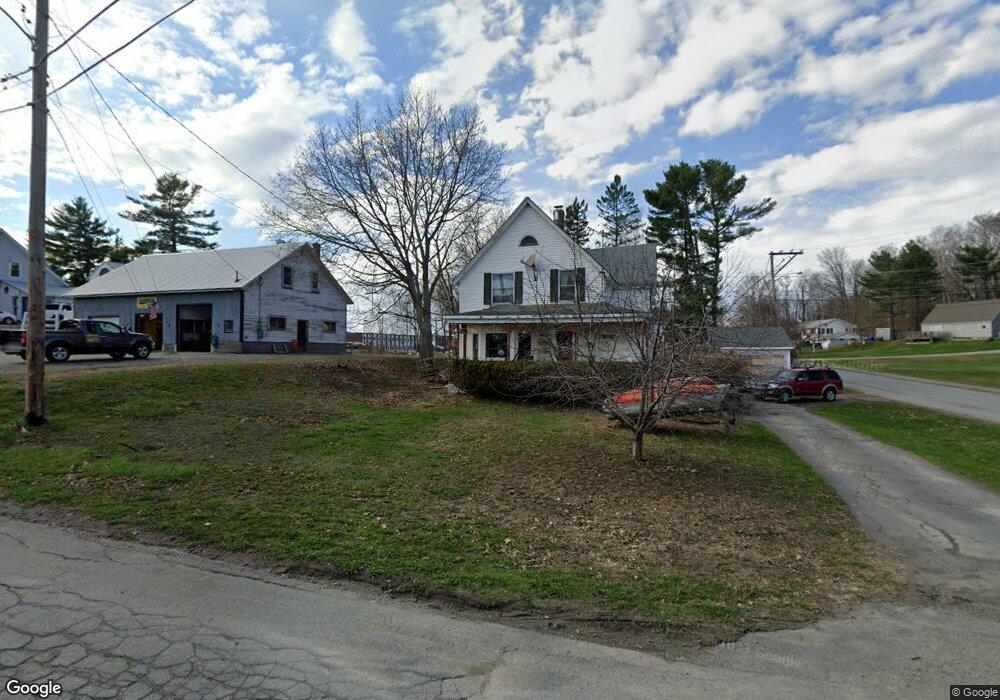
13 Pine St Dexter, ME 04930
Estimated Value: $117,073 - $189,000
Studio
--
Bath
2,500
Sq Ft
$62/Sq Ft
Est. Value
About This Home
This home is located at 13 Pine St, Dexter, ME 04930 and is currently estimated at $154,518, approximately $61 per square foot. 13 Pine St is a home located in Penobscot County with nearby schools including Ridge View Community School, Dexter Regional High School, and Dexter Christian Academy.
Ownership History
Date
Name
Owned For
Owner Type
Purchase Details
Closed on
Jun 30, 2022
Sold by
Wyman Melvin E and Wyman Catherine Catherine
Bought by
Mchenry Roxanne P
Current Estimated Value
Purchase Details
Closed on
Nov 30, 2016
Sold by
Sheila Lucier
Bought by
Mcneil Melvin
Home Financials for this Owner
Home Financials are based on the most recent Mortgage that was taken out on this home.
Original Mortgage
$42,000
Interest Rate
4.03%
Create a Home Valuation Report for This Property
The Home Valuation Report is an in-depth analysis detailing your home's value as well as a comparison with similar homes in the area
Home Values in the Area
Average Home Value in this Area
Purchase History
| Date | Buyer | Sale Price | Title Company |
|---|---|---|---|
| Mchenry Roxanne P | $99,000 | None Available | |
| Mcneil Melvin | -- | -- |
Source: Public Records
Mortgage History
| Date | Status | Borrower | Loan Amount |
|---|---|---|---|
| Previous Owner | Mcneil Melvin | $42,000 | |
| Previous Owner | Mcneil Melvin | -- |
Source: Public Records
Tax History
| Year | Tax Paid | Tax Assessment Tax Assessment Total Assessment is a certain percentage of the fair market value that is determined by local assessors to be the total taxable value of land and additions on the property. | Land | Improvement |
|---|---|---|---|---|
| 2024 | $1,364 | $69,600 | $15,500 | $54,100 |
| 2023 | $1,373 | $69,700 | $15,600 | $54,100 |
| 2022 | $744 | $37,200 | $14,200 | $23,000 |
| 2021 | $729 | $37,200 | $14,200 | $23,000 |
| 2020 | $729 | $37,200 | $14,200 | $23,000 |
| 2019 | $729 | $37,200 | $14,200 | $23,000 |
| 2018 | $729 | $37,200 | $14,200 | $23,000 |
| 2017 | $711 | $37,200 | $14,200 | $23,000 |
| 2016 | $692 | $37,200 | $14,200 | $23,000 |
| 2015 | $692 | $37,200 | $14,200 | $23,000 |
| 2014 | $658 | $37,200 | $14,200 | $23,000 |
Source: Public Records
Map
Nearby Homes
Your Personal Tour Guide
Ask me questions while you tour the home.