Estimated Value: $314,000 - $370,000
--
Bed
--
Bath
1,856
Sq Ft
$181/Sq Ft
Est. Value
About This Home
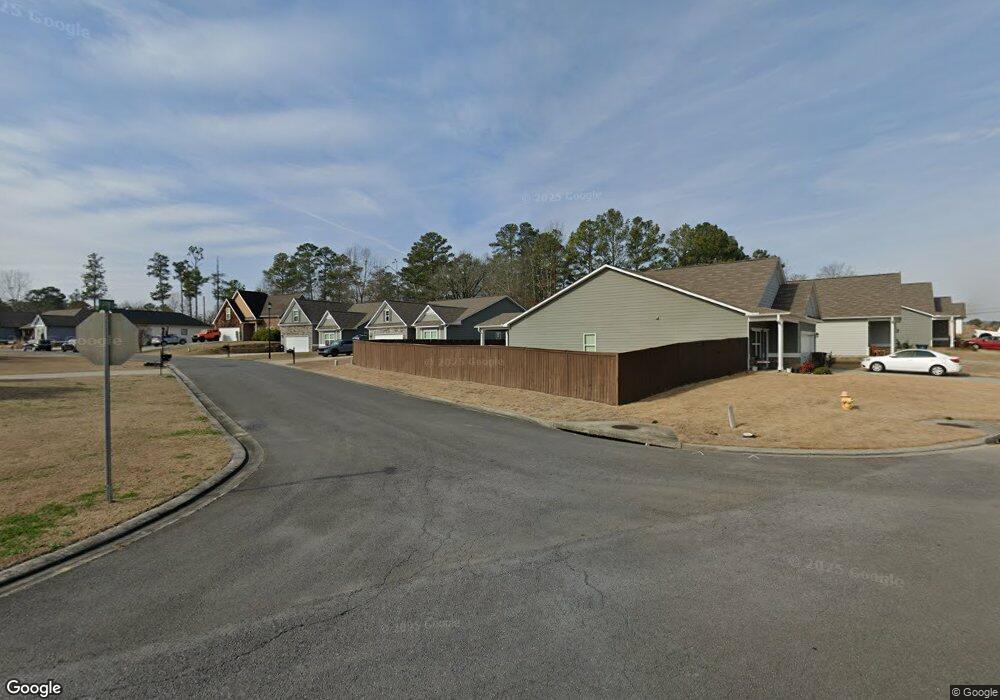
This home is located at 13 Pippin Place NE, Rome, GA 30165 and is currently estimated at $336,080, approximately $181 per square foot. 13 Pippin Place NE is a home with nearby schools including Armuchee Middle School and Armuchee High School.
Ownership History
Date
Name
Owned For
Owner Type
Purchase Details
Closed on
Nov 20, 2020
Sold by
Sdh Atlanta Llc
Bought by
Mccullough Seth Franklin
Current Estimated Value
Home Financials for this Owner
Home Financials are based on the most recent Mortgage that was taken out on this home.
Original Mortgage
$197,202
Outstanding Balance
$174,468
Interest Rate
2.8%
Mortgage Type
New Conventional
Estimated Equity
$161,612
Purchase Details
Closed on
Apr 22, 2020
Sold by
Metro Georgia Properties Llc
Bought by
Sdh Atlanta Llc
Purchase Details
Closed on
May 5, 2006
Sold by
Not Provided
Bought by
Metro Georgia Properties Llc
Purchase Details
Closed on
Sep 3, 2004
Sold by
Toole Mable E
Bought by
Barnett Jeffrey
Purchase Details
Closed on
Mar 14, 1985
Sold by
Blackstock A L
Bought by
Toole Mable E
Purchase Details
Closed on
Nov 27, 1967
Sold by
Sylvan Acres Inc
Bought by
Blackstock A L
Purchase Details
Closed on
Jan 1, 1962
Bought by
Sylvan Acres Inc
Create a Home Valuation Report for This Property
The Home Valuation Report is an in-depth analysis detailing your home's value as well as a comparison with similar homes in the area
Home Values in the Area
Average Home Value in this Area
Purchase History
| Date | Buyer | Sale Price | Title Company |
|---|---|---|---|
| Mccullough Seth Franklin | $195,230 | -- | |
| Sdh Atlanta Llc | -- | -- | |
| Metro Georgia Properties Llc | $14,500 | -- | |
| Barnett Jeffrey | $2,900 | -- | |
| Toole Mable E | $4,500 | -- | |
| Blackstock A L | $1,700 | -- | |
| Sylvan Acres Inc | -- | -- |
Source: Public Records
Mortgage History
| Date | Status | Borrower | Loan Amount |
|---|---|---|---|
| Open | Mccullough Seth Franklin | $197,202 |
Source: Public Records
Tax History Compared to Growth
Tax History
| Year | Tax Paid | Tax Assessment Tax Assessment Total Assessment is a certain percentage of the fair market value that is determined by local assessors to be the total taxable value of land and additions on the property. | Land | Improvement |
|---|---|---|---|---|
| 2024 | $3,273 | $137,287 | $12,600 | $124,687 |
| 2023 | $3,287 | $129,036 | $12,600 | $116,436 |
| 2022 | $2,657 | $94,892 | $12,000 | $82,892 |
| 2021 | $2,297 | $86,198 | $12,000 | $74,198 |
| 2020 | $290 | $8,400 | $8,400 | $0 |
| 2019 | $285 | $8,400 | $8,400 | $0 |
| 2018 | $204 | $5,740 | $5,740 | $0 |
| 2017 | $204 | $5,740 | $5,740 | $0 |
| 2016 | $206 | $5,720 | $5,720 | $0 |
| 2015 | $171 | $5,720 | $5,720 | $0 |
| 2014 | $171 | $5,720 | $5,720 | $0 |
Source: Public Records
Map
Nearby Homes
- 12 Applewood Dr NE
- 20 Pippin Place NE
- 42 Pippin Place NE
- 3 Harbour Rd NE
- 263 E Big Indian Trail NE
- 27 Boxwood Ln NE
- 65 Tency Ln NE
- 264 E Big Indian Trail NE
- 1 Wynnie Rd NE
- 31 Tency Ln NE
- 23 Whistling Oaks Dr NE
- 0 Scott Dr NE
- 9 Royal Oak Dr NE
- 22 Mossy Oaks Ln NE
- 11 Don Dr NE
- 16 Sproull St NE
- 8 Mossy Oaks Ln NE
- 25 Majestic Oaks Way NE
- 12 Majestic Oaks Way NE
- 20 Collier Rd NE
- 11 Pippin Place NE
- 0 Pippin Place NE Unit 8715800
- 0 Pippin Place NE Unit 8617938
- 0 Pippin Place NE Unit 8580931
- 0 Pippin Place NE Unit 8389681
- 0 Pippin Place NE Unit 8392836
- 0 Pippin Place NE Unit 8333966
- 0 Pippin Place NE Unit 9047103
- 0 Pippin Place NE Unit 8756049
- 0 Pippin Place NE Unit 8825954
- 0 Pippin Place NE Unit 8906021
- 0 Pippin Place NE Unit 8906000
- 0 Pippin Place NE Unit 8934282
- 1234 Pippin Place NE
- 0 Pippin Place NE Unit 8100153
- 0 Pippin Place NE
- 10 Applewood Dr NE
- 14 Applewood Dr NE
- 9 Pippin Place NE
- 8 Applewood Dr NE Unit 79