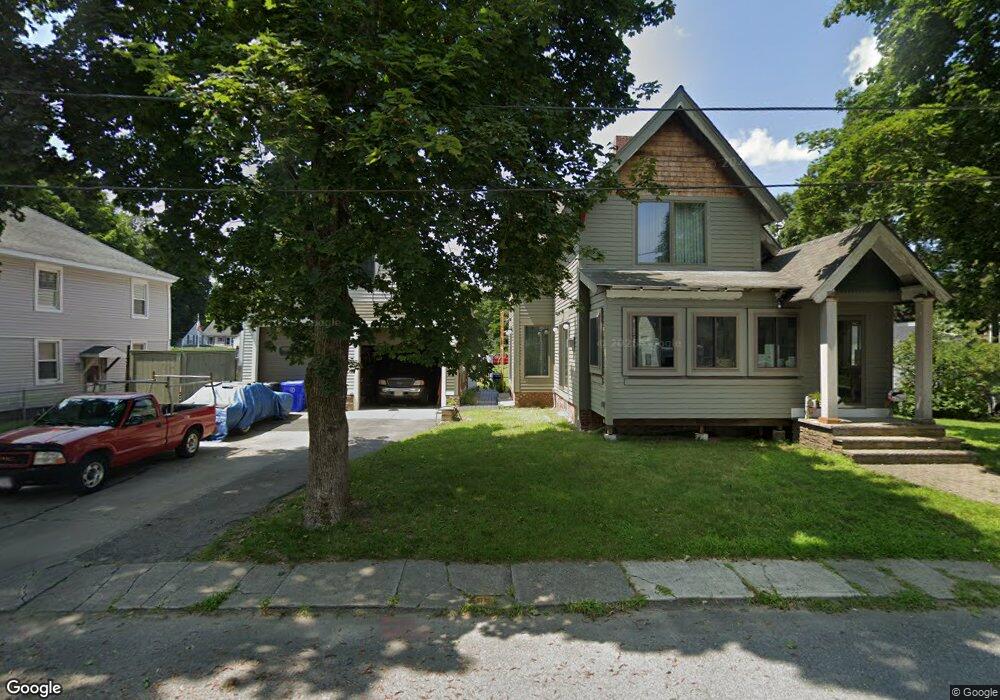
13 Porter St Shirley, MA 01464
Estimated Value: $434,779 - $536,000
3
Beds
3
Baths
1,706
Sq Ft
$289/Sq Ft
Est. Value
About This Home
This home is located at 13 Porter St, Shirley, MA 01464 and is currently estimated at $492,445, approximately $288 per square foot. 13 Porter St is a home with nearby schools including Page Hilltop School, Lura A. White Elementary School, and Ayer Shirley Regional Middle School.
Ownership History
Date
Name
Owned For
Owner Type
Purchase Details
Closed on
Oct 30, 1998
Sold by
Quinty Elaine
Bought by
Thurston Roderick M
Current Estimated Value
Home Financials for this Owner
Home Financials are based on the most recent Mortgage that was taken out on this home.
Original Mortgage
$115,900
Outstanding Balance
$25,498
Interest Rate
6.68%
Mortgage Type
Purchase Money Mortgage
Estimated Equity
$466,947
Purchase Details
Closed on
Jul 16, 1996
Sold by
Kemble Anne
Bought by
Quinty Elaine
Create a Home Valuation Report for This Property
The Home Valuation Report is an in-depth analysis detailing your home's value as well as a comparison with similar homes in the area
Home Values in the Area
Average Home Value in this Area
Purchase History
| Date | Buyer | Sale Price | Title Company |
|---|---|---|---|
| Thurston Roderick M | $122,000 | -- | |
| Quinty Elaine | $47,150 | -- |
Source: Public Records
Mortgage History
| Date | Status | Borrower | Loan Amount |
|---|---|---|---|
| Closed | Quinty Elaine | $42,000 | |
| Open | Quinty Elaine | $115,900 | |
| Previous Owner | Quinty Elaine | $6,500 |
Source: Public Records
Tax History Compared to Growth
Tax History
| Year | Tax Paid | Tax Assessment Tax Assessment Total Assessment is a certain percentage of the fair market value that is determined by local assessors to be the total taxable value of land and additions on the property. | Land | Improvement |
|---|---|---|---|---|
| 2025 | $53 | $405,000 | $130,000 | $275,000 |
| 2024 | $5,044 | $371,700 | $110,900 | $260,800 |
| 2023 | $4,905 | $345,900 | $110,900 | $235,000 |
| 2022 | $4,772 | $308,300 | $107,100 | $201,200 |
| 2021 | $4,670 | $282,500 | $95,600 | $186,900 |
| 2020 | $4,454 | $276,500 | $95,600 | $180,900 |
| 2019 | $4,266 | $265,300 | $95,600 | $169,700 |
| 2018 | $11,465 | $248,400 | $91,800 | $156,600 |
| 2017 | $3,790 | $229,400 | $84,100 | $145,300 |
| 2016 | $3,744 | $226,800 | $85,700 | $141,100 |
| 2015 | $3,493 | $201,800 | $80,300 | $121,500 |
Source: Public Records
Map
Nearby Homes
- 25 Front St
- 30 Ayer Rd
- 40 Ayer Rd
- 27 Lancaster Rd
- 31 Ambrose Way Unit 31
- 6 Ambrose Way Unit 3
- 19 Ambrose Way Unit 19
- 9 Ambrose Way Unit 9
- 1 Ambrose Way Unit 1
- 7 Ambrose Way Unit 5
- 29 Ambrose Way Unit 29
- 4 Ambrose Way Unit 4
- 5 Ambrose Way Unit 5
- 45 Clark Rd
- 83 Clark Rd Unit 41
- 0 Windsor Rd
- 95 Old Union Turnpike
- 12 Meditation Ln Unit 12
- 124 Hazen Rd
- 601 Flat Hill Rd