13 Powers Rd Mendon, MA 01756
Mendon AreaEstimated Value: $734,000 - $827,000
About This Home
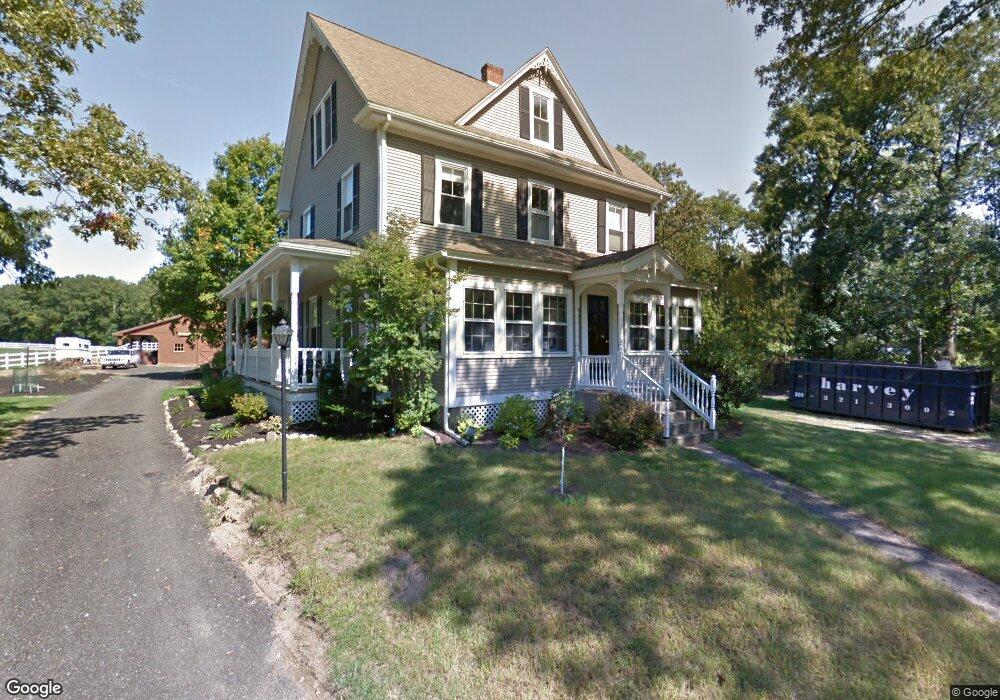
This home is located at 13 Powers Rd, Mendon, MA 01756 and is currently estimated at $764,929, approximately $333 per square foot. 13 Powers Rd is a home located in Worcester County with nearby schools including Nipmuc Regional High School.
Ownership History
We collect this data history from publicly available records. To have your information removed, we recommend requesting removal directly through your county’s website.
Purchase Details
Home Financials for this Owner
Home Financials are based on the most recent Mortgage that was taken out on this home.Purchase Details
Home Financials for this Owner
Home Financials are based on the most recent Mortgage that was taken out on this home.Purchase Details
Home Values in the Area
Average Home Value in this Area
Purchase History
We collect this data history from publicly available records. To have your information removed, we recommend requesting removal directly through your county’s website.
| Date | Buyer | Sale Price | Title Company |
|---|---|---|---|
| $600,000 | None Available | ||
| $395,000 | -- | ||
| $314,500 | -- |
Mortgage History
We collect this data history from publicly available records. To have your information removed, we recommend requesting removal directly through your county’s website.
| Date | Status | Borrower | Loan Amount |
|---|---|---|---|
| Open | $150,000 | ||
| Open | $269,000 | ||
| Previous Owner | $316,000 | ||
| Previous Owner | $39,500 |
Tax History
We collect this data history from publicly available records. To have your information removed, we recommend requesting removal directly through your county’s website.
| Year | Tax Paid | Tax Assessment Tax Assessment Total Assessment is a certain percentage of the fair market value that is determined by local assessors to be the total taxable value of land and additions on the property. | Land | Improvement |
|---|---|---|---|---|
| 2025 | $9,767 | $729,400 | $172,400 | $557,000 |
| 2024 | $9,586 | $699,200 | $165,800 | $533,400 |
| 2023 | $9,272 | $635,100 | $147,900 | $487,200 |
| 2022 | $8,966 | $581,800 | $144,100 | $437,700 |
| 2021 | $8,155 | $485,700 | $139,800 | $345,900 |
| 2020 | $7,599 | $453,700 | $139,800 | $313,900 |
| 2019 | $6,967 | $416,200 | $135,800 | $280,400 |
| 2018 | $6,723 | $396,400 | $135,800 | $260,600 |
| 2017 | $6,546 | $368,800 | $135,800 | $233,000 |
| 2016 | $6,439 | $373,300 | $143,700 | $229,600 |
| 2015 | $5,858 | $365,900 | $143,700 | $222,200 |
| 2014 | $5,520 | $344,600 | $139,300 | $205,300 |
Map
- 324 Mendon St
- 12 Whitney Rd
- 236 Mendon St
- 20 Rawson Farm Rd
- 86 North Ave
- Lot 12 Rawson Farm
- 1 Leone Ln
- 57 Bancroft Park
- 112 Dutcher St
- 88 Northbridge Rd
- 39 Westcott Rd
- 2 Tammie Rd
- 0 West St
- 117 South St
- 20 Country Club Ln Unit D
- 10 Sadler Rd
- 28D Country Club Ln Unit 28D
- 23 Country Club Ln Unit A
- 10 Deluca Rd
- 12 Dartmouth Dr
Ask me questions while you tour the home.