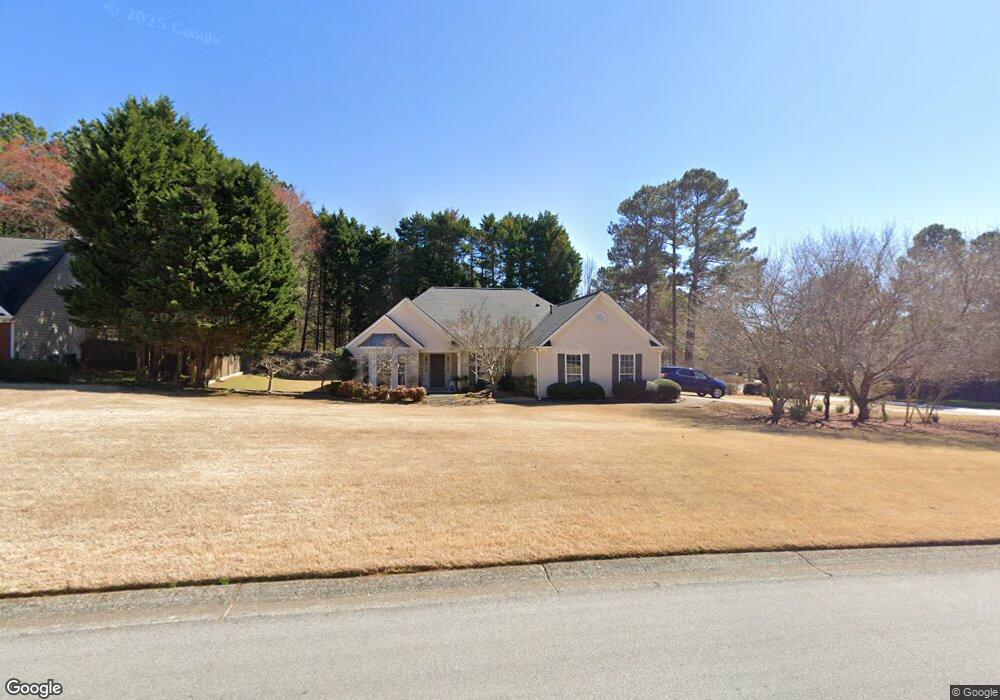
13 Quail Run Acworth, GA 30101
Cedarcrest NeighborhoodEstimated Value: $381,000 - $389,000
3
Beds
2
Baths
1,900
Sq Ft
$202/Sq Ft
Est. Value
About This Home
This home is located at 13 Quail Run, Acworth, GA 30101 and is currently estimated at $383,285, approximately $201 per square foot. 13 Quail Run is a home located in Paulding County with nearby schools including Roland W. Russom Elementary School, East Paulding Middle School, and North Paulding High School.
Ownership History
Date
Name
Owned For
Owner Type
Purchase Details
Closed on
Jun 22, 2023
Sold by
Crowder Margaret Nell
Bought by
Knox Charles
Current Estimated Value
Purchase Details
Closed on
May 9, 2023
Sold by
Crowder Margaret Nell
Bought by
Knox Charles Benton and Diffee Karen Crowder
Purchase Details
Closed on
Jan 9, 2021
Sold by
Knox Charles B
Bought by
Knox Margaret and Knox Charles
Create a Home Valuation Report for This Property
The Home Valuation Report is an in-depth analysis detailing your home's value as well as a comparison with similar homes in the area
Home Values in the Area
Average Home Value in this Area
Purchase History
| Date | Buyer | Sale Price | Title Company |
|---|---|---|---|
| Knox Charles | -- | -- | |
| Knox Charles Benton | -- | -- | |
| Knox Margaret | -- | -- |
Source: Public Records
Tax History Compared to Growth
Tax History
| Year | Tax Paid | Tax Assessment Tax Assessment Total Assessment is a certain percentage of the fair market value that is determined by local assessors to be the total taxable value of land and additions on the property. | Land | Improvement |
|---|---|---|---|---|
| 2024 | $324 | $166,628 | $18,000 | $148,628 |
| 2023 | $299 | $147,896 | $18,000 | $129,896 |
| 2022 | $121 | $116,276 | $18,000 | $98,276 |
| 2021 | $37 | $104,484 | $18,000 | $86,484 |
| 2020 | $1,001 | $95,432 | $18,000 | $77,432 |
| 2019 | $948 | $87,280 | $18,000 | $69,280 |
| 2018 | $850 | $79,568 | $18,000 | $61,568 |
| 2017 | $824 | $74,580 | $18,000 | $56,580 |
| 2016 | $720 | $67,388 | $18,000 | $49,388 |
| 2015 | $701 | $63,208 | $18,000 | $45,208 |
| 2014 | $621 | $53,352 | $18,000 | $35,352 |
| 2013 | -- | $44,640 | $18,000 | $26,640 |
Source: Public Records
Map
Nearby Homes
- 31 Quail Run
- 0 Quail Run
- 81 Summerfield Crossing
- 31 Summerfield Ct
- 120 Summerfield Crossing
- 45 Quail Run
- 139 Summerfield Crossing
- 65 Summerfield Crossing
- 34 Quail Run
- 55 Quail Run
- 57 Summerfield Ct
- 146 Summerfield Crossing
- 123 Dual Test
- 66 Quail Run
- 248 Old Burnt Hickory Rd
- 16 Summerfield Ct
- 175 Summerfield Crossing
- 162 Old Burnt Hickory Rd
- 222 Old Burnt Hickory Rd
- 81 Quail Run