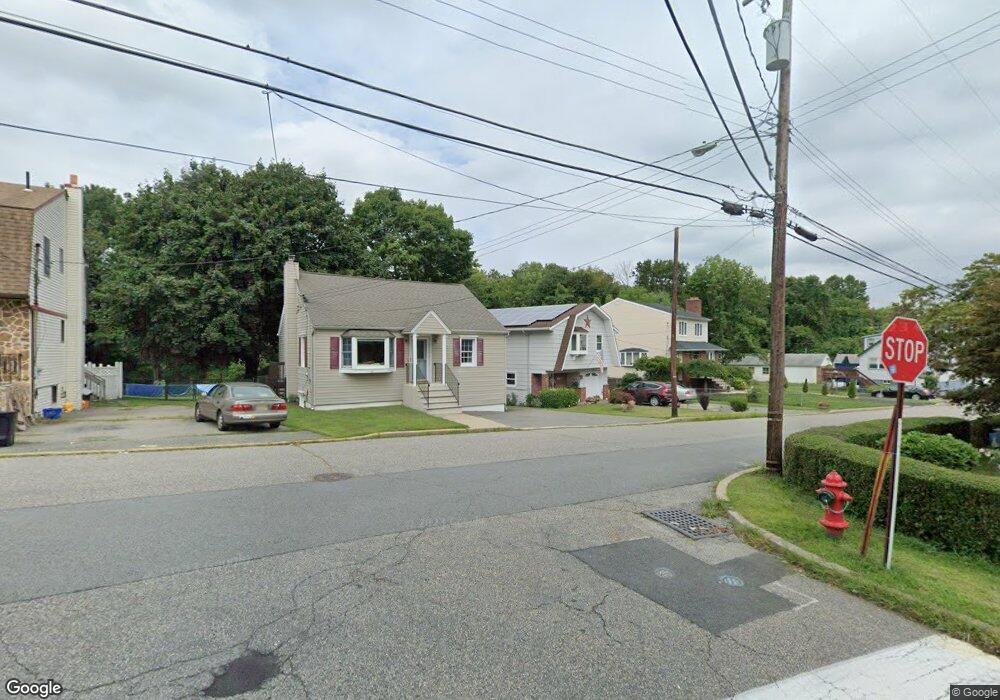
13 Railroad Ave Netcong, NJ 07857
Estimated Value: $432,484 - $506,000
--
Bed
--
Bath
1,794
Sq Ft
$260/Sq Ft
Est. Value
About This Home
This home is located at 13 Railroad Ave, Netcong, NJ 07857 and is currently estimated at $466,621, approximately $260 per square foot. 13 Railroad Ave is a home located in Morris County with nearby schools including Netcong Elementary School, Lenape Val Regional High School, and St. Therese School.
Ownership History
Date
Name
Owned For
Owner Type
Purchase Details
Closed on
Aug 4, 1999
Sold by
Olivo Robert and Olivo Marietta
Bought by
Flannery Rosemary
Current Estimated Value
Home Financials for this Owner
Home Financials are based on the most recent Mortgage that was taken out on this home.
Original Mortgage
$129,600
Outstanding Balance
$37,243
Interest Rate
7.65%
Estimated Equity
$429,378
Purchase Details
Closed on
Jan 11, 1999
Sold by
Investors Svgs Bank
Bought by
Olivo Robert and Olivo Marietta
Purchase Details
Closed on
Oct 22, 1998
Sold by
Bruzzese Mario and Bruzzese Irma
Bought by
Olivo Robert and Olivo Marietta
Home Financials for this Owner
Home Financials are based on the most recent Mortgage that was taken out on this home.
Original Mortgage
$30,000
Interest Rate
6.3%
Create a Home Valuation Report for This Property
The Home Valuation Report is an in-depth analysis detailing your home's value as well as a comparison with similar homes in the area
Home Values in the Area
Average Home Value in this Area
Purchase History
| Date | Buyer | Sale Price | Title Company |
|---|---|---|---|
| Flannery Rosemary | $144,000 | Fidelity National Title Ins | |
| Olivo Robert | $70,000 | -- | |
| Olivo Robert | $130,000 | Commonwealth Land Title Ins |
Source: Public Records
Mortgage History
| Date | Status | Borrower | Loan Amount |
|---|---|---|---|
| Open | Flannery Rosemary | $129,600 | |
| Previous Owner | Olivo Robert | $30,000 |
Source: Public Records
Tax History Compared to Growth
Tax History
| Year | Tax Paid | Tax Assessment Tax Assessment Total Assessment is a certain percentage of the fair market value that is determined by local assessors to be the total taxable value of land and additions on the property. | Land | Improvement |
|---|---|---|---|---|
| 2025 | $8,074 | $236,300 | $79,200 | $157,100 |
| 2024 | $8,145 | $236,300 | $79,200 | $157,100 |
| 2023 | $8,145 | $236,300 | $79,200 | $157,100 |
| 2022 | $7,362 | $236,300 | $79,200 | $157,100 |
| 2021 | $7,362 | $236,300 | $79,200 | $157,100 |
| 2020 | $9,102 | $295,900 | $164,500 | $131,400 |
| 2019 | $8,664 | $295,900 | $164,500 | $131,400 |
| 2018 | $8,146 | $295,900 | $164,500 | $131,400 |
| 2017 | $7,827 | $295,900 | $164,500 | $131,400 |
| 2016 | $7,614 | $295,900 | $164,500 | $131,400 |
| 2015 | $7,335 | $295,900 | $164,500 | $131,400 |
| 2014 | $7,016 | $295,900 | $164,500 | $131,400 |
Source: Public Records
Map
Nearby Homes
- 11 Railroad Ave
- 15 Railroad Ave
- 9 Railroad Ave
- 36 Barone St
- 7 Railroad Ave
- 19 Railroad Ave
- 99 Barone St Unit 5
- 35 Barone St
- 21 Railroad Ave
- 34 Barone St
- 22 Railroad Ave
- 33 Barone St
- 30 Barone St
- 6 Union St
- 27 Barone St
- 25 Railroad Ave Unit 27
- 32 Barone St
- 8 Union St Unit A
- 8 Union St Unit B
- 8 Union St