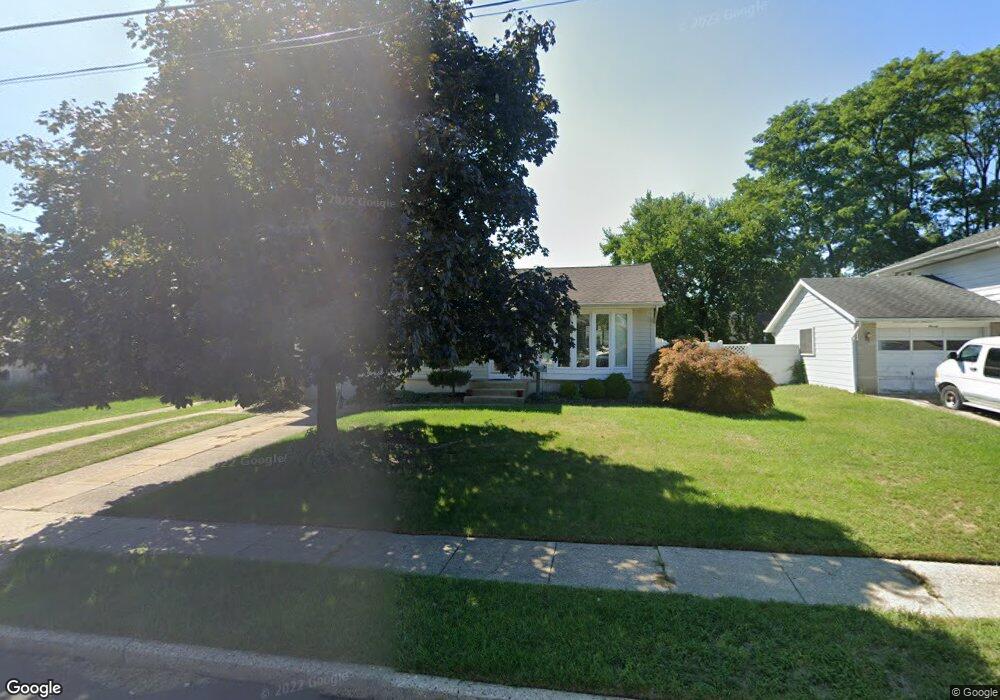
13 Randy Rd Glendora, NJ 08029
Estimated Value: $262,552 - $345,000
--
Bed
--
Bath
1,230
Sq Ft
$262/Sq Ft
Est. Value
About This Home
This home is located at 13 Randy Rd, Glendora, NJ 08029 and is currently estimated at $322,388, approximately $262 per square foot. 13 Randy Rd is a home located in Camden County with nearby schools including Glen Landing Middle School, Triton High School, and St. Teresa Regional School.
Ownership History
Date
Name
Owned For
Owner Type
Purchase Details
Closed on
Jun 6, 2019
Sold by
Murray Daniel and Mascarenhas Madeleine
Bought by
Murray Daniel
Current Estimated Value
Home Financials for this Owner
Home Financials are based on the most recent Mortgage that was taken out on this home.
Original Mortgage
$97,950
Outstanding Balance
$85,947
Interest Rate
4%
Mortgage Type
New Conventional
Estimated Equity
$236,441
Purchase Details
Closed on
Feb 27, 1998
Sold by
Barbieri Yetta
Bought by
Murray Daniel and Mascarenas Madeline
Home Financials for this Owner
Home Financials are based on the most recent Mortgage that was taken out on this home.
Original Mortgage
$92,000
Interest Rate
6.93%
Mortgage Type
FHA
Create a Home Valuation Report for This Property
The Home Valuation Report is an in-depth analysis detailing your home's value as well as a comparison with similar homes in the area
Home Values in the Area
Average Home Value in this Area
Purchase History
| Date | Buyer | Sale Price | Title Company |
|---|---|---|---|
| Murray Daniel | -- | None Available | |
| Murray Daniel | $100,000 | -- |
Source: Public Records
Mortgage History
| Date | Status | Borrower | Loan Amount |
|---|---|---|---|
| Open | Murray Daniel | $97,950 | |
| Closed | Murray Daniel | $92,000 |
Source: Public Records
Tax History Compared to Growth
Tax History
| Year | Tax Paid | Tax Assessment Tax Assessment Total Assessment is a certain percentage of the fair market value that is determined by local assessors to be the total taxable value of land and additions on the property. | Land | Improvement |
|---|---|---|---|---|
| 2025 | $7,632 | $180,600 | $60,000 | $120,600 |
| 2024 | $7,378 | $180,600 | $60,000 | $120,600 |
| 2023 | $7,378 | $180,600 | $60,000 | $120,600 |
| 2022 | $7,338 | $180,600 | $60,000 | $120,600 |
| 2021 | $7,156 | $180,600 | $60,000 | $120,600 |
| 2020 | $7,190 | $180,600 | $60,000 | $120,600 |
| 2019 | $7,031 | $180,600 | $60,000 | $120,600 |
| 2018 | $7,000 | $180,600 | $60,000 | $120,600 |
| 2017 | $8,156 | $180,600 | $60,000 | $120,600 |
| 2016 | $6,624 | $180,600 | $60,000 | $120,600 |
| 2015 | $6,149 | $180,600 | $60,000 | $120,600 |
| 2014 | $6,113 | $180,600 | $60,000 | $120,600 |
Source: Public Records
Map
Nearby Homes