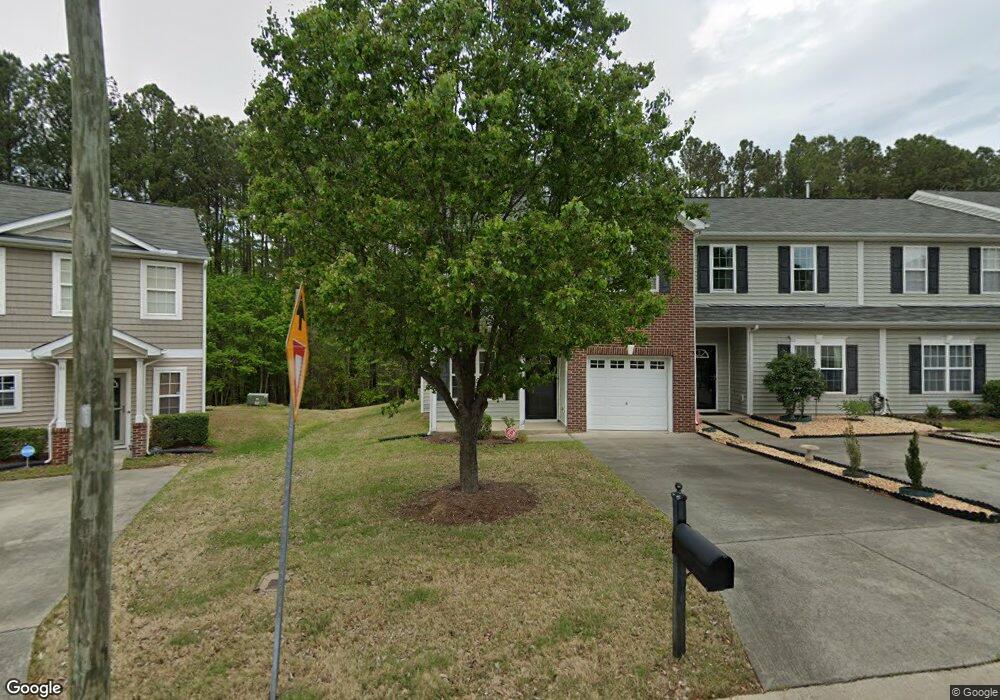
13 Red Feather Ct Durham, NC 27704
Eastern Durham NeighborhoodEstimated Value: $261,000 - $275,000
3
Beds
3
Baths
1,542
Sq Ft
$174/Sq Ft
Est. Value
About This Home
This home is located at 13 Red Feather Ct, Durham, NC 27704 and is currently estimated at $268,569, approximately $174 per square foot. 13 Red Feather Ct is a home located in Durham County with nearby schools including Glenn Elementary, John W Neal Middle School, and Southern School of Energy & Sustainability.
Ownership History
Date
Name
Owned For
Owner Type
Purchase Details
Closed on
Jul 11, 2014
Sold by
Us Bank Na
Bought by
Wells Jameka
Current Estimated Value
Home Financials for this Owner
Home Financials are based on the most recent Mortgage that was taken out on this home.
Original Mortgage
$105,159
Outstanding Balance
$81,108
Interest Rate
4.5%
Mortgage Type
FHA
Estimated Equity
$187,461
Purchase Details
Closed on
May 9, 2014
Sold by
Page Kris L
Bought by
Us Bank National Assn
Purchase Details
Closed on
Oct 20, 2011
Sold by
Beazer Homes Corp
Bought by
Cardinal Lake Owners Association Inc
Purchase Details
Closed on
Jun 1, 2006
Sold by
Beazer Homes Corp
Bought by
Page Kris L
Home Financials for this Owner
Home Financials are based on the most recent Mortgage that was taken out on this home.
Original Mortgage
$141,007
Interest Rate
10.35%
Mortgage Type
Fannie Mae Freddie Mac
Create a Home Valuation Report for This Property
The Home Valuation Report is an in-depth analysis detailing your home's value as well as a comparison with similar homes in the area
Home Values in the Area
Average Home Value in this Area
Purchase History
| Date | Buyer | Sale Price | Title Company |
|---|---|---|---|
| Wells Jameka | $108,000 | None Available | |
| Us Bank National Assn | $101,840 | None Available | |
| Cardinal Lake Owners Association Inc | $3,827 | None Available | |
| Page Kris L | $141,500 | None Available |
Source: Public Records
Mortgage History
| Date | Status | Borrower | Loan Amount |
|---|---|---|---|
| Open | Wells Jameka | $105,159 | |
| Previous Owner | Page Kris L | $141,007 |
Source: Public Records
Tax History
| Year | Tax Paid | Tax Assessment Tax Assessment Total Assessment is a certain percentage of the fair market value that is determined by local assessors to be the total taxable value of land and additions on the property. | Land | Improvement |
|---|---|---|---|---|
| 2025 | $2,741 | $276,461 | $40,000 | $236,461 |
| 2024 | $2,262 | $162,144 | $30,000 | $132,144 |
| 2023 | $2,124 | $162,144 | $30,000 | $132,144 |
| 2022 | $2,075 | $162,144 | $30,000 | $132,144 |
| 2021 | $2,066 | $162,144 | $30,000 | $132,144 |
| 2020 | $2,017 | $162,144 | $30,000 | $132,144 |
| 2019 | $2,017 | $162,144 | $30,000 | $132,144 |
| 2018 | $1,838 | $135,489 | $25,000 | $110,489 |
| 2017 | $1,824 | $135,489 | $25,000 | $110,489 |
| 2016 | $1,763 | $135,489 | $25,000 | $110,489 |
| 2015 | $2,045 | $147,720 | $26,500 | $121,220 |
| 2014 | -- | $147,720 | $26,500 | $121,220 |
Source: Public Records
Map
Nearby Homes
- 1213 Opal Ln
- 1201 Opal Ln
- 20 Hidden Meadow Ct
- 4300-4304 Cheek Rd
- 3721 Brightwood Ln
- 2113 Fletchers Ridge Dr
- 608 Clearfield Dr
- 107 Galena Ct
- 4144 Rustic Ridge Dr
- 1110 Caswell Way Ct
- 3022 Hammer Creek Rd
- 516 Cove Hollow Dr
- 3515 Cheek Rd
- 603 Timber Terrace Dr
- 3034 Hammer Creek Rd
- 3032 Hammer Creek Rd
- 1135 Sawmill Grove Dr
- 1136 Sawmill Grove Dr
- 1127 Sawmill Grove Dr
- 1206 Sawmill Grove Dr
- 15 Red Feather Ct
- 11 Red Feather Ct
- 17 Red Feather Ct
- 9 Red Feather Ct
- 19 Red Feather Ct
- 7 Red Feather Ct
- 5 Red Feather Ct
- 3 Red Feather Ct
- 14 Red Feather Ct
- 16 Red Feather Ct
- 18 Red Feather Ct
- 20 Red Feather Ct
- 1 Red Feather Ct
- 22 Red Feather Ct
- 24 Red Feather Ct
- 21 Heatherford Ct
- 3613 Cardinal Lake Dr
- 19 Heatherford Ct
- 20 Heatherford Ct
- 3615 Cardinal Lake Dr
Your Personal Tour Guide
Ask me questions while you tour the home.