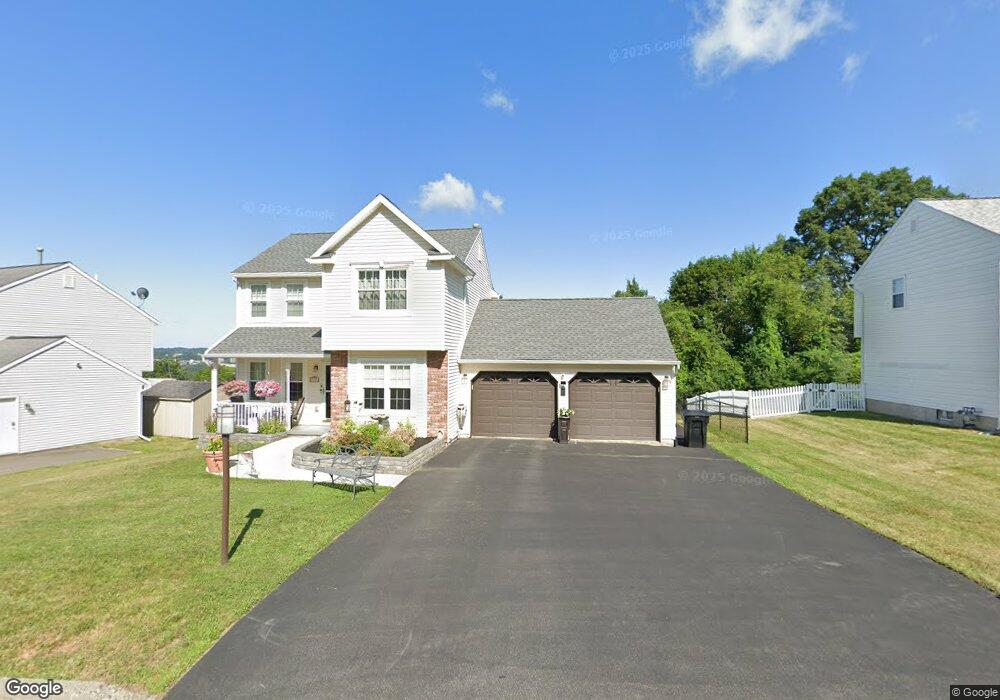
13 Red Rock Rd Troy, NY 12182
Lansingburgh NeighborhoodEstimated Value: $343,092 - $463,000
3
Beds
2
Baths
1,416
Sq Ft
$271/Sq Ft
Est. Value
About This Home
This home is located at 13 Red Rock Rd, Troy, NY 12182 and is currently estimated at $384,023, approximately $271 per square foot. 13 Red Rock Rd is a home located in Rensselaer County with nearby schools including Turnpike Elementary School, Rensselaer Park Elementary School, and Knickerbacker Middle School.
Ownership History
Date
Name
Owned For
Owner Type
Purchase Details
Closed on
Jun 25, 2009
Sold by
Gilbert Frederick
Bought by
Gilbert Federick
Current Estimated Value
Purchase Details
Closed on
Nov 13, 1998
Sold by
Keystone Homes Inc
Bought by
Gilbert Frederick C and Gilbert Helen
Create a Home Valuation Report for This Property
The Home Valuation Report is an in-depth analysis detailing your home's value as well as a comparison with similar homes in the area
Home Values in the Area
Average Home Value in this Area
Purchase History
| Date | Buyer | Sale Price | Title Company |
|---|---|---|---|
| Gilbert Federick | -- | -- | |
| Gilbert Frederick C | $131,000 | -- |
Source: Public Records
Tax History
| Year | Tax Paid | Tax Assessment Tax Assessment Total Assessment is a certain percentage of the fair market value that is determined by local assessors to be the total taxable value of land and additions on the property. | Land | Improvement |
|---|---|---|---|---|
| 2024 | $7,639 | $191,000 | $24,000 | $167,000 |
| 2023 | $7,588 | $191,000 | $24,000 | $167,000 |
| 2022 | $4,856 | $191,000 | $24,000 | $167,000 |
| 2021 | $1,905 | $191,000 | $24,000 | $167,000 |
| 2020 | $2,848 | $191,000 | $24,000 | $167,000 |
| 2019 | $3,615 | $191,000 | $24,000 | $167,000 |
| 2018 | $4,548 | $191,000 | $24,000 | $167,000 |
| 2017 | $5,983 | $191,000 | $24,000 | $167,000 |
| 2016 | $6,299 | $191,000 | $24,000 | $167,000 |
| 2015 | -- | $191,000 | $24,000 | $167,000 |
| 2014 | -- | $191,000 | $24,000 | $167,000 |
Source: Public Records
Map
Nearby Homes
Your Personal Tour Guide
Ask me questions while you tour the home.