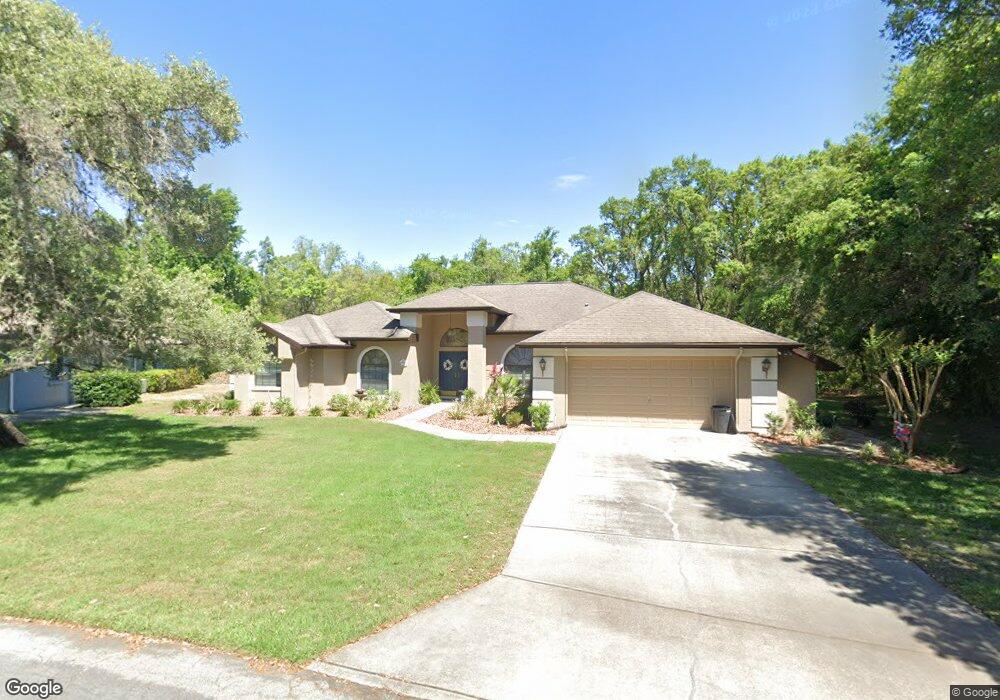
13 Redbay Ct E Homosassa, FL 34446
Cypress Village at Sugarmill Woods NeighborhoodEstimated Value: $313,670 - $352,000
3
Beds
2
Baths
2,196
Sq Ft
$155/Sq Ft
Est. Value
About This Home
This home is located at 13 Redbay Ct E, Homosassa, FL 34446 and is currently estimated at $340,418, approximately $155 per square foot. 13 Redbay Ct E is a home located in Citrus County with nearby schools including Lecanto Primary School, Lecanto Middle School, and Lecanto High School.
Ownership History
Date
Name
Owned For
Owner Type
Purchase Details
Closed on
Oct 30, 2025
Sold by
Caffera Joseph L and Caffera Dolores A
Bought by
Caffera Nicholas M and Caffera Joseph L
Current Estimated Value
Purchase Details
Closed on
Feb 20, 2004
Sold by
Hamel David F and Hamel June C
Bought by
Caffera Joseph L and Caffera Dolores A
Purchase Details
Closed on
Mar 1, 1995
Bought by
Caffera Joseph L and Caffera Dolores A
Purchase Details
Closed on
Jun 1, 1986
Bought by
Caffera Joseph L and Caffera Dolores A
Create a Home Valuation Report for This Property
The Home Valuation Report is an in-depth analysis detailing your home's value as well as a comparison with similar homes in the area
Home Values in the Area
Average Home Value in this Area
Purchase History
| Date | Buyer | Sale Price | Title Company |
|---|---|---|---|
| Caffera Nicholas M | $100 | None Listed On Document | |
| Caffera Joseph L | $180,000 | Southern Sun Title Company | |
| Caffera Joseph L | $17,500 | -- | |
| Caffera Joseph L | $9,900 | -- |
Source: Public Records
Tax History
| Year | Tax Paid | Tax Assessment Tax Assessment Total Assessment is a certain percentage of the fair market value that is determined by local assessors to be the total taxable value of land and additions on the property. | Land | Improvement |
|---|---|---|---|---|
| 2025 | $1,777 | $153,859 | -- | -- |
| 2024 | $1,728 | $149,523 | -- | -- |
| 2023 | $1,728 | $145,168 | $0 | $0 |
| 2022 | $1,674 | $140,940 | $0 | $0 |
| 2021 | $1,608 | $136,835 | $0 | $0 |
| 2020 | $1,505 | $173,711 | $7,000 | $166,711 |
| 2019 | $1,489 | $157,845 | $8,850 | $148,995 |
| 2018 | $1,460 | $143,437 | $7,330 | $136,107 |
| 2017 | $1,455 | $126,789 | $9,000 | $117,789 |
| 2016 | $2,127 | $125,559 | $9,000 | $116,559 |
| 2015 | $2,146 | $123,678 | $12,100 | $111,578 |
| 2014 | $2,077 | $115,200 | $7,949 | $107,251 |
Source: Public Records
Map
Nearby Homes
Your Personal Tour Guide
Ask me questions while you tour the home.