Estimated Value: $164,266 - $192,000
2
Beds
2
Baths
1,092
Sq Ft
$160/Sq Ft
Est. Value
About This Home
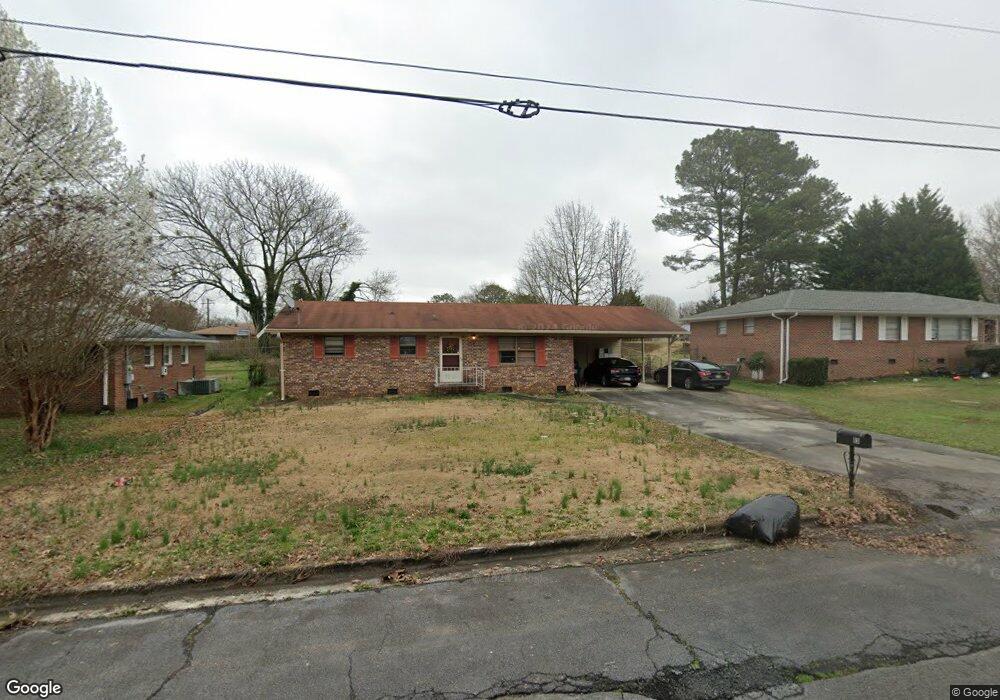
This home is located at 13 Ridge Dr SW, Rome, GA 30165 and is currently estimated at $175,067, approximately $160 per square foot. 13 Ridge Dr SW is a home located in Floyd County with nearby schools including Rome High School.
Ownership History
Date
Name
Owned For
Owner Type
Purchase Details
Closed on
Oct 4, 2018
Sold by
Colley Jennifer A
Bought by
Ratzmann Stephen Adam
Current Estimated Value
Home Financials for this Owner
Home Financials are based on the most recent Mortgage that was taken out on this home.
Original Mortgage
$76,587
Outstanding Balance
$66,788
Interest Rate
4.5%
Mortgage Type
FHA
Estimated Equity
$108,279
Purchase Details
Closed on
Oct 23, 2009
Sold by
Murphy Jean Ann
Bought by
Colley Jennifer A
Home Financials for this Owner
Home Financials are based on the most recent Mortgage that was taken out on this home.
Original Mortgage
$72,751
Interest Rate
5.01%
Mortgage Type
FHA
Purchase Details
Closed on
Dec 18, 2008
Sold by
Espy Ruby Nell
Bought by
Murphy Jean Ann and Ayers Carol Juanita
Purchase Details
Closed on
Nov 26, 1995
Bought by
Espy Ruby Nell
Purchase Details
Closed on
Jan 16, 1995
Bought by
P and R
Create a Home Valuation Report for This Property
The Home Valuation Report is an in-depth analysis detailing your home's value as well as a comparison with similar homes in the area
Home Values in the Area
Average Home Value in this Area
Purchase History
| Date | Buyer | Sale Price | Title Company |
|---|---|---|---|
| Ratzmann Stephen Adam | $78,000 | -- | |
| Colley Jennifer A | $77,500 | -- | |
| Murphy Jean Ann | -- | -- | |
| Espy Ruby Nell | -- | -- | |
| P | -- | -- |
Source: Public Records
Mortgage History
| Date | Status | Borrower | Loan Amount |
|---|---|---|---|
| Open | Ratzmann Stephen Adam | $76,587 | |
| Previous Owner | Colley Jennifer A | $72,751 | |
| Previous Owner | Colley Jennifer A | $6,000 |
Source: Public Records
Tax History Compared to Growth
Tax History
| Year | Tax Paid | Tax Assessment Tax Assessment Total Assessment is a certain percentage of the fair market value that is determined by local assessors to be the total taxable value of land and additions on the property. | Land | Improvement |
|---|---|---|---|---|
| 2024 | $1,321 | $49,156 | $9,920 | $39,236 |
| 2023 | $1,260 | $46,592 | $8,960 | $37,632 |
| 2022 | $1,168 | $38,769 | $7,360 | $31,409 |
| 2021 | $1,059 | $32,284 | $7,360 | $24,924 |
| 2020 | $1,012 | $29,124 | $5,600 | $23,524 |
| 2019 | $979 | $27,723 | $5,600 | $22,123 |
| 2018 | $911 | $24,606 | $5,600 | $19,006 |
| 2017 | $882 | $23,834 | $5,600 | $18,234 |
| 2016 | $975 | $26,248 | $5,600 | $20,648 |
| 2015 | $959 | $26,248 | $5,600 | $20,648 |
| 2014 | $959 | $27,337 | $5,600 | $21,737 |
Source: Public Records
Map
Nearby Homes
- 200 Coosawattee Ave SW
- 5 Ridge Dr SW
- 3 Oak Ridge Ct NE
- 25 Ridge Dr SW
- 216 Coosawattee Ave SW
- 15 John Ross Dr SW
- 111 Deerbrook Dr SW
- 0 Westlyn Dr Unit 10599621
- 0 Westlyn Dr Unit 7645405
- 43 Westwood Cir SW
- 3 Lovell Ln SW
- 209 Larkspur Ln SW
- 106 Coker Dr SW
- 1 Westlyn Dr SW
- 0 Lovell Ln Unit 7662536
- 0 Lovell Ln Unit 10620627
- 0 Cedartown Rd Unit 10479932
- 16 Jefferson Dr SW
- 9 Ladonna Place SW
- 30 Westover Dr SW
- 15 Ridge Dr SW
- 11 Ridge Dr SW
- 0 Ridge Dr SW Unit 8837336
- 0 Ridge Dr SW Unit 8639558
- 0 Ridge Dr SW Unit 8459899
- 0 Ridge Dr SW Unit 8120931
- 0 Ridge Dr SW Unit 8182729
- 0 Ridge Dr SW Unit 7440341
- 0 Ridge Dr SW
- 202 Coosawattee Ave SW
- 17 Ridge Dr SW
- 9 Ridge Dr SW
- 204 Coosawattee Ave SW
- 8 Ridge Dr SW
- 10 Ridge Dr SW
- 206 Coosawattee Ave SW
- 106 Coosawattee Ave SW
- 1 Chief Vann Dr SW
- 7 Ridge Dr SW
- 19 Ridge Dr SW