Estimated Value: $1,144,187 - $1,402,000
5
Beds
4
Baths
3,090
Sq Ft
$410/Sq Ft
Est. Value
About This Home
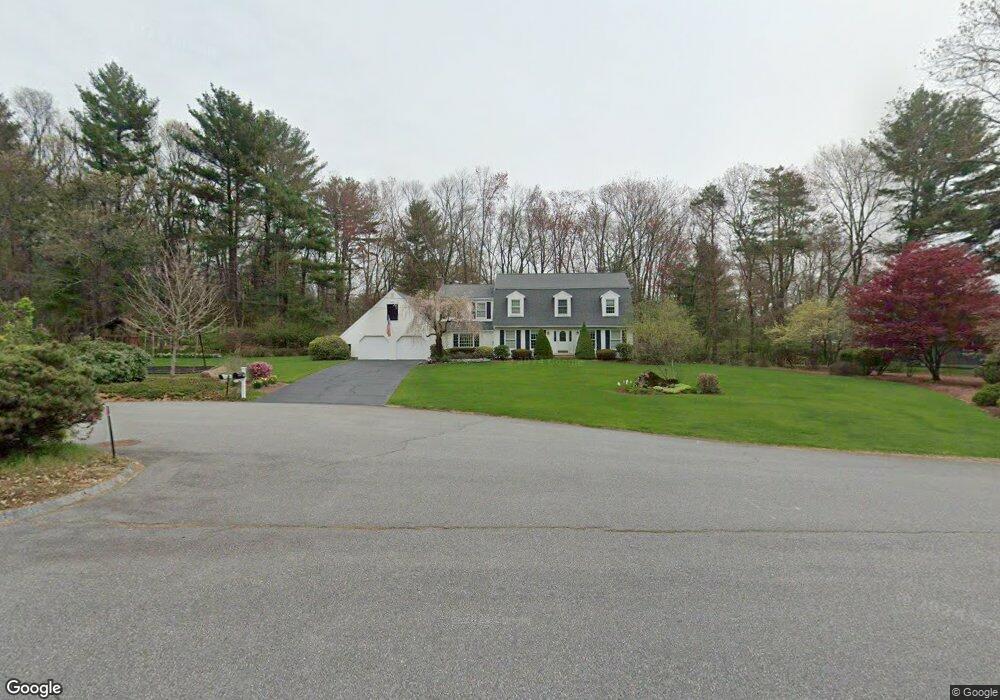
This home is located at 13 Robert Rd, Acton, MA 01720 and is currently estimated at $1,265,547, approximately $409 per square foot. 13 Robert Rd is a home located in Middlesex County with nearby schools including Acton-Boxborough Regional High School, Maynard Knowledge Beginnings, and The Imago School.
Ownership History
Date
Name
Owned For
Owner Type
Purchase Details
Closed on
Dec 30, 2015
Sold by
Phenix Ft and Phenix Brian D
Bought by
Susan J S Phenix Ft and Phenix Brian D
Current Estimated Value
Create a Home Valuation Report for This Property
The Home Valuation Report is an in-depth analysis detailing your home's value as well as a comparison with similar homes in the area
Home Values in the Area
Average Home Value in this Area
Purchase History
| Date | Buyer | Sale Price | Title Company |
|---|---|---|---|
| Susan J S Phenix Ft | -- | -- |
Source: Public Records
Tax History
| Year | Tax Paid | Tax Assessment Tax Assessment Total Assessment is a certain percentage of the fair market value that is determined by local assessors to be the total taxable value of land and additions on the property. | Land | Improvement |
|---|---|---|---|---|
| 2025 | $19,707 | $1,149,100 | $357,800 | $791,300 |
| 2024 | $18,322 | $1,099,100 | $357,800 | $741,300 |
| 2023 | $17,909 | $1,019,900 | $324,900 | $695,000 |
| 2022 | $17,048 | $876,500 | $282,500 | $594,000 |
| 2021 | $16,678 | $824,400 | $261,600 | $562,800 |
| 2020 | $15,711 | $816,600 | $261,600 | $555,000 |
| 2019 | $13,551 | $699,600 | $261,600 | $438,000 |
| 2018 | $13,512 | $697,200 | $261,600 | $435,600 |
| 2017 | $12,921 | $677,900 | $261,600 | $416,300 |
| 2016 | $12,640 | $657,300 | $261,600 | $395,700 |
| 2015 | $12,390 | $650,400 | $261,600 | $388,800 |
| 2014 | $12,183 | $626,400 | $261,600 | $364,800 |
Source: Public Records
Map
Nearby Homes
- 1 Drummer Rd Unit A5
- 63 Conant St
- 128 Parker St Unit 3B
- 31 Drummer Rd Unit 31
- 30 Brewster Ln
- 36 Brown St
- 70 Powder Mill Rd
- 68 Powder Mill Rd
- 66 Powder Mill Rd
- 40 High St
- 12 Brown St
- 1 Vanderbelt Rd
- 70 River St
- 23 Deer Path Unit 5
- 7 Hillcrest Dr
- 96 Forest Ridge Rd Unit 96
- 129 Main St Unit 129
- 131 Main St
- 22 Douglas Ave Unit 2
- 22 Douglas Ave Unit 1
Your Personal Tour Guide
Ask me questions while you tour the home.