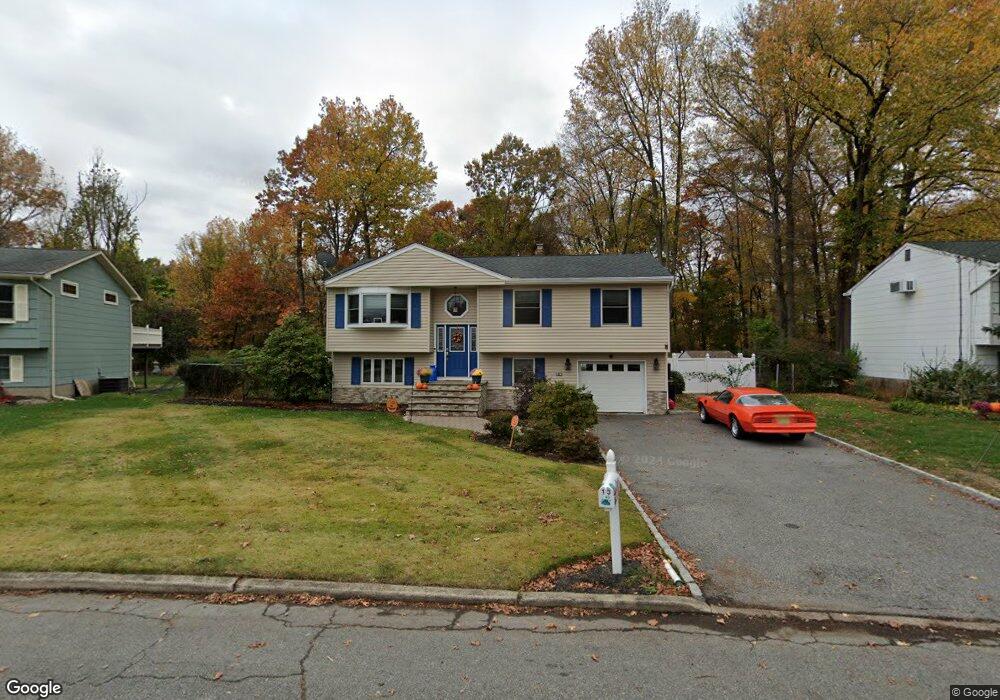
13 Roland Rd Pequannock, NJ 07440
Estimated Value: $512,000 - $613,000
--
Bed
--
Bath
1,872
Sq Ft
$296/Sq Ft
Est. Value
About This Home
This home is located at 13 Roland Rd, Pequannock, NJ 07440 and is currently estimated at $553,610, approximately $295 per square foot. 13 Roland Rd is a home located in Morris County with nearby schools including Pequannock Twp High School, Holy Spirit School, and Kolbe Immaculata School.
Ownership History
Date
Name
Owned For
Owner Type
Purchase Details
Closed on
Apr 26, 2005
Sold by
Zellwegwe Virginia
Bought by
Mcmorrow Virginia and Mcmorrow David
Current Estimated Value
Home Financials for this Owner
Home Financials are based on the most recent Mortgage that was taken out on this home.
Original Mortgage
$238,000
Outstanding Balance
$125,765
Interest Rate
6.05%
Mortgage Type
Adjustable Rate Mortgage/ARM
Estimated Equity
$427,845
Create a Home Valuation Report for This Property
The Home Valuation Report is an in-depth analysis detailing your home's value as well as a comparison with similar homes in the area
Home Values in the Area
Average Home Value in this Area
Purchase History
| Date | Buyer | Sale Price | Title Company |
|---|---|---|---|
| Mcmorrow Virginia | -- | -- |
Source: Public Records
Mortgage History
| Date | Status | Borrower | Loan Amount |
|---|---|---|---|
| Open | Mcmorrow Virginia | $238,000 |
Source: Public Records
Tax History Compared to Growth
Tax History
| Year | Tax Paid | Tax Assessment Tax Assessment Total Assessment is a certain percentage of the fair market value that is determined by local assessors to be the total taxable value of land and additions on the property. | Land | Improvement |
|---|---|---|---|---|
| 2025 | $7,674 | $433,200 | $231,000 | $202,200 |
| 2024 | $7,495 | $420,500 | $226,500 | $194,000 |
| 2023 | $7,495 | $407,800 | $217,500 | $190,300 |
| 2022 | $6,350 | $254,300 | $122,100 | $132,200 |
| 2021 | $6,065 | $254,300 | $122,100 | $132,200 |
| 2020 | $6,269 | $254,300 | $122,100 | $132,200 |
| 2019 | $6,065 | $254,300 | $122,100 | $132,200 |
| 2018 | $5,836 | $254,300 | $122,100 | $132,200 |
| 2017 | $5,648 | $254,300 | $122,100 | $132,200 |
| 2016 | $5,470 | $254,300 | $122,100 | $132,200 |
| 2015 | $5,445 | $254,300 | $122,100 | $132,200 |
| 2014 | $5,315 | $254,300 | $122,100 | $132,200 |
Source: Public Records
Map
Nearby Homes
- 20 Newark Pompton Turnpike
- 0 Oakwood Ave Unit 3989632
- 38 Marlin Ave
- 00 Oakwood Ave
- 237 Whitmore Ave
- 111 Packanack Lake Rd
- 195 Newark Pompton Turnpike
- 197 Ratzer Rd
- 78 Verkade Dr
- 35 Randolph St
- 15 Slingerland Ave
- 15 4th St
- 17 4th St
- 32 Parsons Rd
- 10 Hilltop Terrace
- 8 Wheeler Rd
- 120 Greenwood Ave
- 39 William St
- 140 de Hart St
- 108 Boulevard