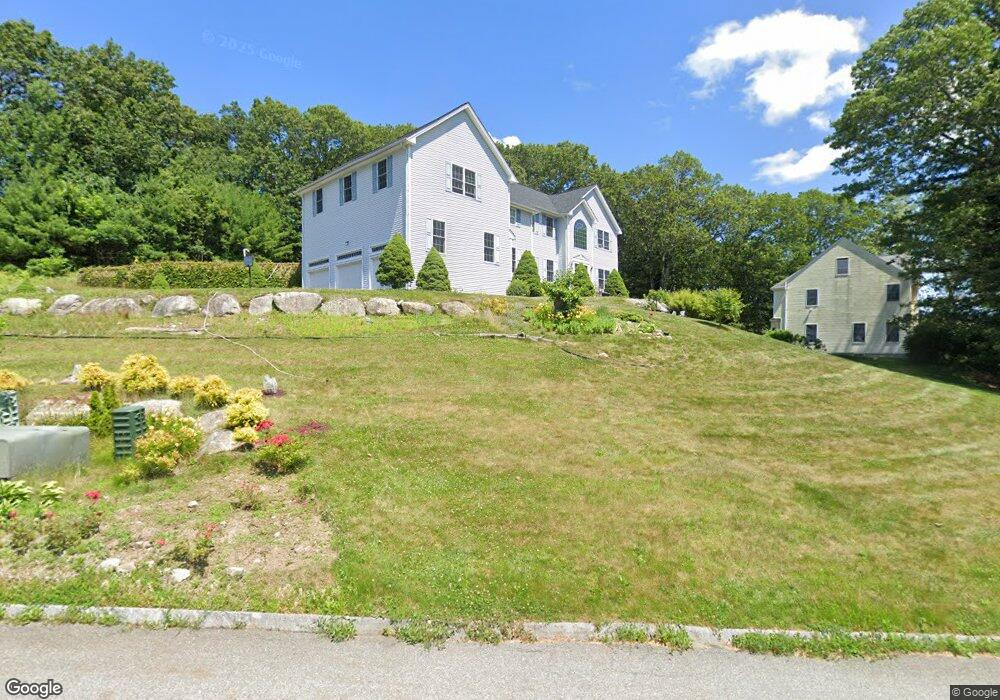
13 Rome Dr Unit 1,13 Westford, MA 01886
Estimated Value: $1,267,000 - $1,570,000
4
Beds
4
Baths
3,805
Sq Ft
$359/Sq Ft
Est. Value
About This Home
This home is located at 13 Rome Dr Unit 1,13, Westford, MA 01886 and is currently estimated at $1,364,561, approximately $358 per square foot. 13 Rome Dr Unit 1,13 is a home located in Middlesex County with nearby schools including Abbot Elementary School, Nabnasset Elementary, and Stony Brook School.
Ownership History
Date
Name
Owned For
Owner Type
Purchase Details
Closed on
Jul 30, 2007
Sold by
Cheng Hong and Sui Wenquan
Bought by
Cheng Gang and Yang Meng
Current Estimated Value
Purchase Details
Closed on
Oct 24, 2002
Sold by
Angelcrest Inc
Bought by
Sui Wenquan
Create a Home Valuation Report for This Property
The Home Valuation Report is an in-depth analysis detailing your home's value as well as a comparison with similar homes in the area
Home Values in the Area
Average Home Value in this Area
Purchase History
| Date | Buyer | Sale Price | Title Company |
|---|---|---|---|
| Cheng Gang | $626,000 | -- | |
| Sui Wenquan | $529,900 | -- |
Source: Public Records
Mortgage History
| Date | Status | Borrower | Loan Amount |
|---|---|---|---|
| Open | Sui Wenquan | $336,000 | |
| Closed | Sui Wenquan | $369,000 | |
| Closed | Sui Wenquan | $375,000 | |
| Closed | Sui Wenquan | $380,000 |
Source: Public Records
Tax History Compared to Growth
Tax History
| Year | Tax Paid | Tax Assessment Tax Assessment Total Assessment is a certain percentage of the fair market value that is determined by local assessors to be the total taxable value of land and additions on the property. | Land | Improvement |
|---|---|---|---|---|
| 2025 | $15,034 | $1,091,800 | $383,100 | $708,700 |
| 2024 | $15,034 | $1,091,800 | $383,100 | $708,700 |
| 2023 | $14,559 | $986,400 | $365,100 | $621,300 |
| 2022 | $14,302 | $887,200 | $282,800 | $604,400 |
| 2021 | $13,367 | $803,300 | $282,800 | $520,500 |
| 2020 | $13,188 | $807,600 | $282,800 | $524,800 |
| 2019 | $12,738 | $769,200 | $282,800 | $486,400 |
| 2018 | $12,446 | $769,200 | $282,800 | $486,400 |
| 2017 | $11,791 | $718,500 | $282,800 | $435,700 |
| 2016 | $11,553 | $708,800 | $269,600 | $439,200 |
| 2015 | $11,459 | $705,600 | $263,000 | $442,600 |
| 2014 | $11,552 | $695,900 | $261,300 | $434,600 |
Source: Public Records
Map
Nearby Homes
- 4 Drew Crossing
- 16 Main St Unit 2
- 158 Westview Dr Unit 158
- 1 Fieldstone Dr
- 17 Carlisle Rd
- 3 Woolsack Dr
- 14 Fieldstone Dr
- 22 Carlisle Rd
- 5 Colonel Rolls Dr
- 1 Lawton Ave
- 28 Graniteville Rd
- 4 Fairview Dr
- 1 Courtney Ln
- 1 Woodridge Ln
- 28 Southgate Rd Unit 35
- 18 Fletcher Rd
- 7 Mill Park Place
- 24 Bandon Cir Unit 24
- 1 Thistle Ln
- 6 Plain Rd