Estimated Value: $406,000 - $453,000
5
Beds
2
Baths
2,116
Sq Ft
$201/Sq Ft
Est. Value
About This Home
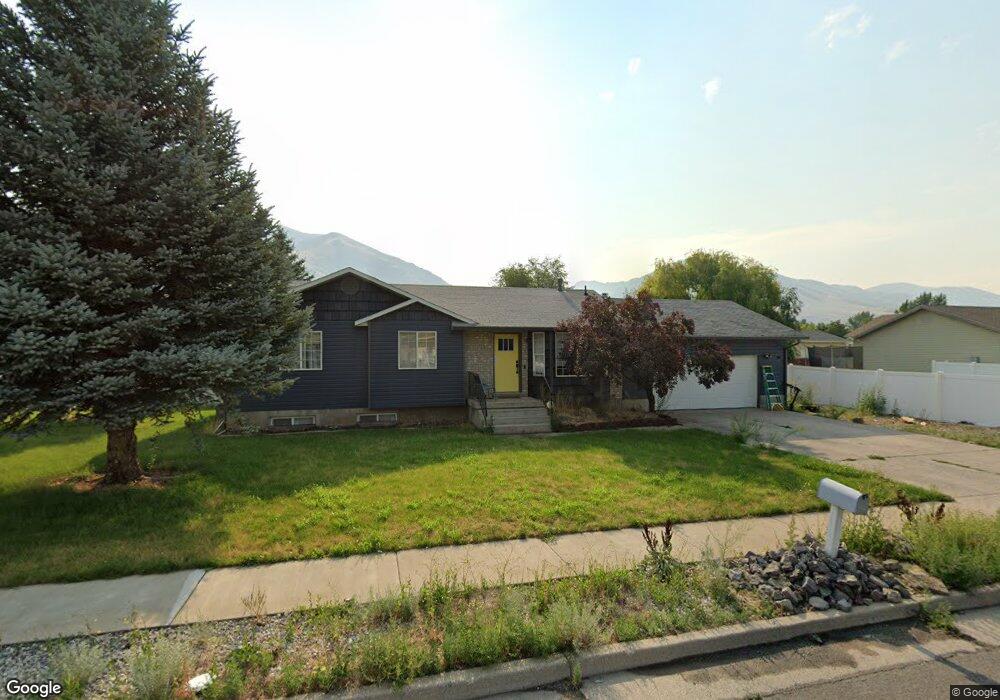
This home is located at 13 S 1100 E, Hyrum, UT 84319 and is currently estimated at $425,135, approximately $200 per square foot. 13 S 1100 E is a home located in Cache County with nearby schools including Canyon School, South Cache Middle School, and Mountain Crest High School.
Ownership History
Date
Name
Owned For
Owner Type
Purchase Details
Closed on
Feb 16, 2022
Sold by
Milen Burbank Joseph
Bought by
Bradshaw Jonathan S and Haws Jackie L
Current Estimated Value
Home Financials for this Owner
Home Financials are based on the most recent Mortgage that was taken out on this home.
Original Mortgage
$434,343
Outstanding Balance
$400,229
Interest Rate
3.55%
Mortgage Type
New Conventional
Estimated Equity
$24,906
Purchase Details
Closed on
Oct 21, 2013
Sold by
French Anita Ann
Bought by
Burbank Joseph Milen
Home Financials for this Owner
Home Financials are based on the most recent Mortgage that was taken out on this home.
Original Mortgage
$160,784
Interest Rate
4.46%
Mortgage Type
VA
Purchase Details
Closed on
Jun 16, 2011
Sold by
French Jeffrey Ronald
Bought by
French Jeffrey Ronald and French Anita Ann
Purchase Details
Closed on
Jan 14, 2010
Sold by
French Anita Ann
Bought by
French Jeffrey Ronald
Purchase Details
Closed on
Jun 29, 2006
Sold by
Deffinger Brian Paul
Bought by
French Jeffrey Ronald and French Anita Ann
Home Financials for this Owner
Home Financials are based on the most recent Mortgage that was taken out on this home.
Original Mortgage
$147,900
Interest Rate
6.57%
Mortgage Type
New Conventional
Purchase Details
Closed on
May 7, 2002
Sold by
Deffinger Kimberly June
Bought by
Deffinger Brian Paul
Create a Home Valuation Report for This Property
The Home Valuation Report is an in-depth analysis detailing your home's value as well as a comparison with similar homes in the area
Home Values in the Area
Average Home Value in this Area
Purchase History
| Date | Buyer | Sale Price | Title Company |
|---|---|---|---|
| Bradshaw Jonathan S | -- | American Secure Title | |
| Burbank Joseph Milen | -- | Access Title Company | |
| French Jeffrey Ronald | -- | Pinnacle Title Insurance Age | |
| French Jeffrey Ronald | -- | Pinnacle Title Insurance Age | |
| French Jeffrey Ronald | -- | Cache Title Company | |
| Deffinger Brian Paul | -- | -- |
Source: Public Records
Mortgage History
| Date | Status | Borrower | Loan Amount |
|---|---|---|---|
| Open | Bradshaw Jonathan S | $434,343 | |
| Previous Owner | Burbank Joseph Milen | $160,784 | |
| Previous Owner | French Jeffrey Ronald | $147,900 |
Source: Public Records
Tax History
| Year | Tax Paid | Tax Assessment Tax Assessment Total Assessment is a certain percentage of the fair market value that is determined by local assessors to be the total taxable value of land and additions on the property. | Land | Improvement |
|---|---|---|---|---|
| 2025 | $1,550 | $222,605 | $0 | $0 |
| 2024 | $1,678 | $225,015 | $0 | $0 |
| 2023 | $1,836 | $235,410 | $0 | $0 |
| 2022 | $1,916 | $235,410 | $0 | $0 |
| 2021 | $1,556 | $294,475 | $65,050 | $229,425 |
| 2020 | $1,295 | $230,006 | $65,050 | $164,956 |
| 2019 | $1,227 | $204,956 | $40,000 | $164,956 |
| 2018 | $1,136 | $183,440 | $40,000 | $143,440 |
| 2017 | $1,118 | $93,720 | $0 | $0 |
| 2016 | $1,143 | $93,720 | $0 | $0 |
| 2015 | $1,030 | $84,195 | $0 | $0 |
| 2014 | $1,007 | $84,195 | $0 | $0 |
| 2013 | -- | $84,195 | $0 | $0 |
Source: Public Records
Map
Nearby Homes
- 122 Wapiti Loop
- 288 S 1130 E
- 864 E 250 N
- 862 E 250 N
- 860 E 250 N
- 858 E 250 N
- 856 E 250 N
- 215 N 800 E
- 762 Anderson Ave
- 1382 E 340 S
- 651 E 20 S
- 1274 E 480 S
- 1290 E 480 S
- 1211 E 500 S
- 355 Scenic View Dr
- 751 E 440 S
- 5025 S Hollow Rd Unit 44
- 5025 S Hollow Rd Unit 45
- 5025 S Hollow Rd Unit 47
- 5025 S Hollow Rd
- 13 Manitoban Ln
- 1105 E 30 S
- 25 Manitoban Ln
- 1109 Rocky Mountain Way
- 1109 Rocky Mountain Way
- 12 S 1100 E
- 1093 E 30 S
- 37 Manitoban Ln
- 1082 E Highway 101
- 1108 Rocky Mountain Way
- 18 Manitoban Ln
- 1104 E 30 S
- 6 Manitoban Ln
- 1081 E 30 S
- 49 Manitoban Ln
- 1112 E 30 S
- 1088 E 30 S
- 30 Manitoban Ln
- 1072 E Highway 101
- 182 Wapiti Loop
Your Personal Tour Guide
Ask me questions while you tour the home.