Estimated Value: $122,000 - $194,000
3
Beds
2
Baths
1,296
Sq Ft
$109/Sq Ft
Est. Value
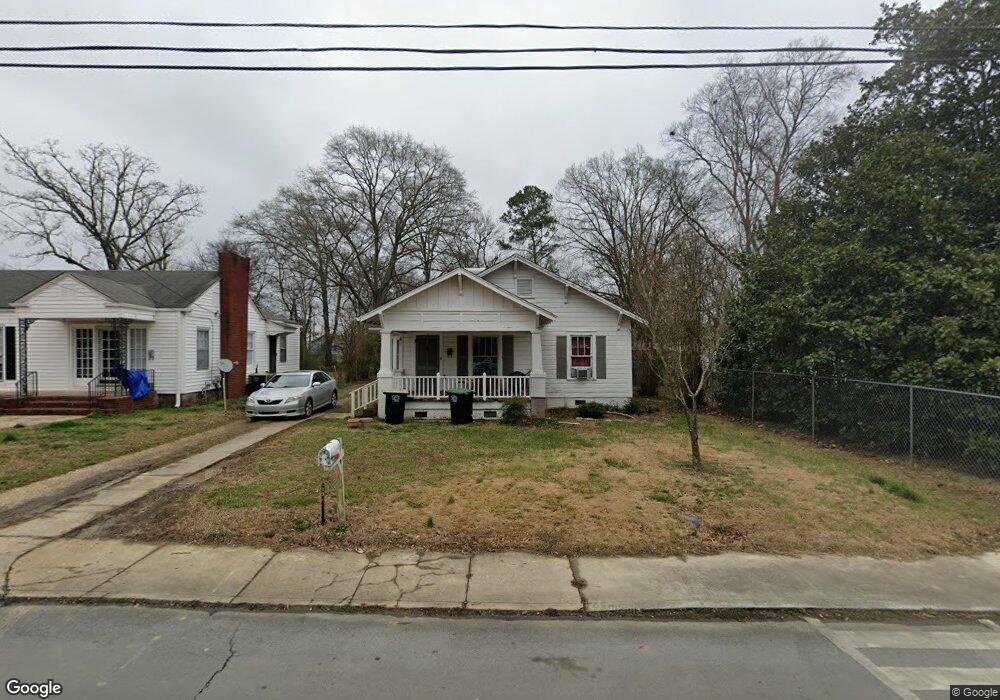
About This Home
This home is located at 13 S Elm St SW, Rome, GA 30165 and is currently estimated at $141,548, approximately $109 per square foot. 13 S Elm St SW is a home located in Floyd County with nearby schools including Rome High School and St. Mary School.
Ownership History
Date
Name
Owned For
Owner Type
Purchase Details
Closed on
Mar 15, 2017
Sold by
Williamson Nicole Woodley
Bought by
Mendoza Sebastian Pascual Dieg
Current Estimated Value
Purchase Details
Closed on
Nov 21, 2011
Sold by
Smith Mary
Bought by
Williamson Nicole Woodley
Home Financials for this Owner
Home Financials are based on the most recent Mortgage that was taken out on this home.
Original Mortgage
$50,681
Interest Rate
3.4%
Mortgage Type
FHA
Purchase Details
Closed on
Nov 17, 2011
Sold by
Smith James D
Bought by
Smith Mary
Home Financials for this Owner
Home Financials are based on the most recent Mortgage that was taken out on this home.
Original Mortgage
$50,681
Interest Rate
3.4%
Mortgage Type
FHA
Purchase Details
Closed on
May 20, 1999
Sold by
Smith Dudley and Mary Smith
Bought by
Smith Mary S
Purchase Details
Closed on
Apr 25, 1991
Sold by
Smith J Dudley
Bought by
Smith Dudley and Mary Smith
Purchase Details
Closed on
Oct 13, 1960
Bought by
Smith J Dudley
Create a Home Valuation Report for This Property
The Home Valuation Report is an in-depth analysis detailing your home's value as well as a comparison with similar homes in the area
Home Values in the Area
Average Home Value in this Area
Purchase History
| Date | Buyer | Sale Price | Title Company |
|---|---|---|---|
| Mendoza Sebastian Pascual Dieg | $44,000 | -- | |
| Williamson Nicole Woodley | $52,000 | -- | |
| Smith Mary | -- | -- | |
| Smith Mary | -- | -- | |
| Smith Mary | -- | -- | |
| Smith Mary S | -- | -- | |
| Smith Dudley | -- | -- | |
| Smith J Dudley | -- | -- |
Source: Public Records
Mortgage History
| Date | Status | Borrower | Loan Amount |
|---|---|---|---|
| Previous Owner | Smith Mary | $50,681 | |
| Previous Owner | Smith Mary | $50,681 |
Source: Public Records
Tax History Compared to Growth
Tax History
| Year | Tax Paid | Tax Assessment Tax Assessment Total Assessment is a certain percentage of the fair market value that is determined by local assessors to be the total taxable value of land and additions on the property. | Land | Improvement |
|---|---|---|---|---|
| 2024 | $1,589 | $40,837 | $6,357 | $34,480 |
| 2023 | $1,446 | $38,644 | $5,650 | $32,994 |
| 2022 | $1,164 | $31,897 | $4,709 | $27,188 |
| 2021 | $1,065 | $28,697 | $4,709 | $23,988 |
| 2020 | $976 | $26,072 | $3,532 | $22,540 |
| 2019 | $912 | $24,636 | $3,532 | $21,104 |
| 2018 | $651 | $23,188 | $3,532 | $19,656 |
| 2017 | $813 | $23,242 | $3,532 | $19,710 |
| 2016 | $850 | $24,189 | $3,520 | $20,669 |
| 2015 | $804 | $24,189 | $3,520 | $20,669 |
| 2014 | $804 | $24,189 | $3,520 | $20,669 |
Source: Public Records
Map
Nearby Homes
- 8 S Hughes St SW
- 204 Cherry St SW
- 8 Leon St SW
- 21 Sweetspire Dr NW
- 23 Sweetspire Dr NW
- 15 Silverbell Ln
- 50 Melton Ave SW
- 214 N Elm St NW
- 0 Mount Alto Rd SW Unit 10523740
- 100 Dellwood Dr NW
- 13 Ridgewood Rd SW
- 14 Berckman Ln SW
- 40 Paris Dr SW
- 3 Berckman Ln SW
- 19 Berckman Ln SW
- 311 Wilkerson Rd SW
- 313 Wilkerson Rd SW
- 55 Ridgewood Rd SW
- 207 Paris Dr SW
- 209 Sherwood Rd SW
- 11 S Elm St SW
- 17 S Elm St SW
- 9 S Elm St SW
- 9 S Elm St SW
- 7 S Elm St SW
- 10 Cherry St SW
- 101 S Elm St SW
- 12 Cherry St SW
- 14 Cherry St SW
- 100 S Elm St SW
- 6 Cherry St SW
- 103 S Elm St SW
- 18 Cherry St SW
- 102 S Elm St SW
- 105 S Elm St SW
- 102 Cherry St SW
- 1007 Ethel Ave SW
- 104 S Elm St SW
- 107 S Elm St SW
- 106 S Elm St SW