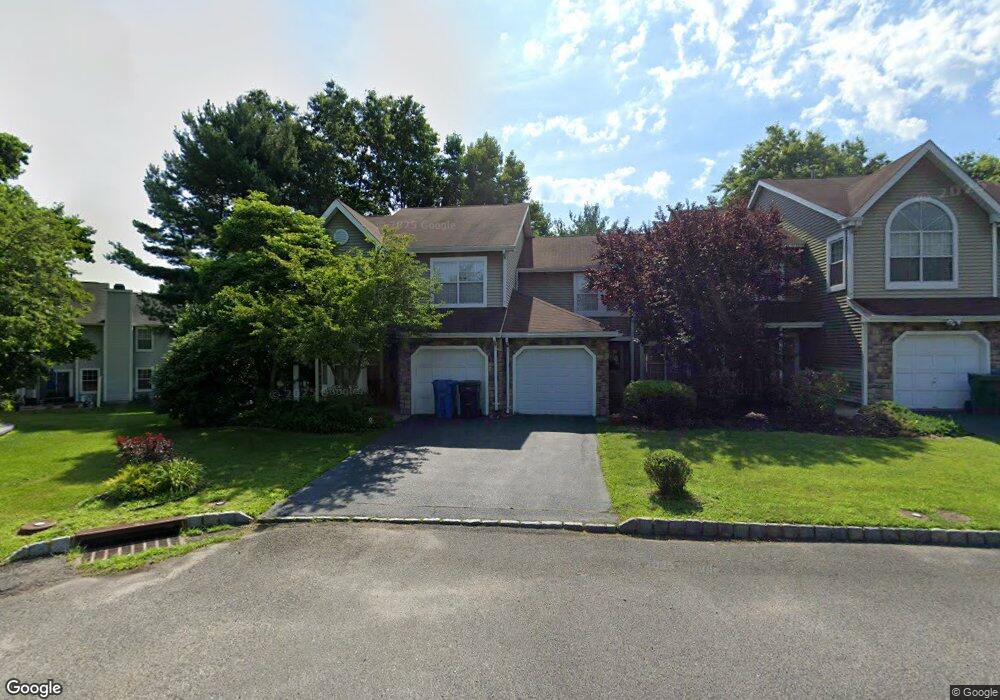
13 Saddle Ct Tinton Falls, NJ 07753
Estimated Value: $472,000 - $537,000
3
Beds
2
Baths
1,676
Sq Ft
$309/Sq Ft
Est. Value
About This Home
This home is located at 13 Saddle Ct, Tinton Falls, NJ 07753 and is currently estimated at $517,313, approximately $308 per square foot. 13 Saddle Ct is a home located in Monmouth County with nearby schools including Mahala F. Atchinson Elementary School, Swimming River Elementary School, and Tinton Falls Middle School.
Ownership History
Date
Name
Owned For
Owner Type
Purchase Details
Closed on
Nov 30, 2005
Sold by
Lund Frederick W
Bought by
Winick Andrew R and Winick Meredith B
Current Estimated Value
Home Financials for this Owner
Home Financials are based on the most recent Mortgage that was taken out on this home.
Original Mortgage
$268,000
Outstanding Balance
$148,877
Interest Rate
6.17%
Mortgage Type
New Conventional
Estimated Equity
$368,436
Purchase Details
Closed on
Oct 31, 2002
Sold by
Nay Jane
Bought by
Lund Frederick
Home Financials for this Owner
Home Financials are based on the most recent Mortgage that was taken out on this home.
Original Mortgage
$171,000
Interest Rate
6.18%
Create a Home Valuation Report for This Property
The Home Valuation Report is an in-depth analysis detailing your home's value as well as a comparison with similar homes in the area
Home Values in the Area
Average Home Value in this Area
Purchase History
| Date | Buyer | Sale Price | Title Company |
|---|---|---|---|
| Winick Andrew R | $335,000 | -- | |
| Lund Frederick | $180,000 | -- | |
| Nay Jane | $132,775 | -- |
Source: Public Records
Mortgage History
| Date | Status | Borrower | Loan Amount |
|---|---|---|---|
| Open | Winick Andrew R | $268,000 | |
| Previous Owner | Nay Jane | $171,000 |
Source: Public Records
Tax History Compared to Growth
Tax History
| Year | Tax Paid | Tax Assessment Tax Assessment Total Assessment is a certain percentage of the fair market value that is determined by local assessors to be the total taxable value of land and additions on the property. | Land | Improvement |
|---|---|---|---|---|
| 2025 | $6,558 | $479,000 | $225,500 | $253,500 |
| 2024 | $6,226 | $455,700 | $208,000 | $247,700 |
| 2023 | $6,226 | $408,000 | $165,000 | $243,000 |
| 2022 | $5,757 | $352,600 | $135,000 | $217,600 |
| 2021 | $5,454 | $298,900 | $120,000 | $178,900 |
| 2020 | $5,582 | $279,800 | $105,000 | $174,800 |
| 2019 | $5,454 | $273,800 | $100,000 | $173,800 |
| 2018 | $5,209 | $260,700 | $95,000 | $165,700 |
| 2017 | $5,239 | $255,700 | $95,000 | $160,700 |
| 2016 | $5,144 | $245,400 | $90,000 | $155,400 |
| 2015 | $5,357 | $258,800 | $95,000 | $163,800 |
| 2014 | $5,665 | $261,800 | $95,000 | $166,800 |
Source: Public Records
Map
Nearby Homes
- 7 Basset Ct
- 36 Saratoga Ct
- 652 Wardell Rd
- 25 Jockey Ln Unit 73
- 69 Maywood Run
- 6 Groom Ct
- 12 Bridle Path
- 34 Mount Run
- 16 Chapel Ln
- 3020 Shafto Rd
- 18 Garrison Dr
- 1961 Jumping Brook Rd
- 42 Diane Dr
- 65 Charles Dr
- 12 Diane Dr
- 87 Diane Dr
- 16 Karen Dr
- 1100 Green Grove Rd
- 345 Green Grove Rd
- 54 Victoria Gardens Square