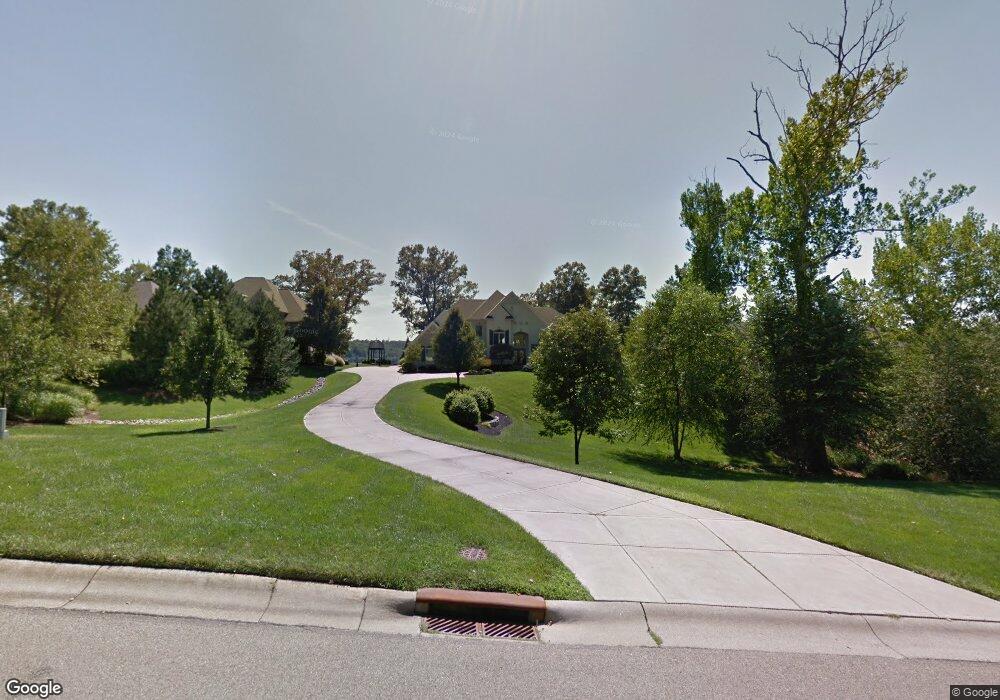
13 Saint Andrews Dr North Bend, OH 45052
Estimated Value: $711,000 - $1,250,598
4
Beds
5
Baths
4,158
Sq Ft
$243/Sq Ft
Est. Value
About This Home
This home is located at 13 Saint Andrews Dr, North Bend, OH 45052 and is currently estimated at $1,010,866, approximately $243 per square foot. 13 Saint Andrews Dr is a home located in Hamilton County with nearby schools including Charles T. Young Elementary School, Taylor Middle School, and Taylor High School.
Ownership History
Date
Name
Owned For
Owner Type
Purchase Details
Closed on
Apr 6, 2020
Sold by
Sims J Scott J and Sims Kimberly L
Bought by
Sims Kimberly L and Scott Sims J
Current Estimated Value
Purchase Details
Closed on
Dec 30, 2015
Sold by
Burn James H and Lyman Mary Karin
Bought by
Hulette Kimberly L and Scott Sims J
Home Financials for this Owner
Home Financials are based on the most recent Mortgage that was taken out on this home.
Original Mortgage
$880,000
Outstanding Balance
$674,111
Interest Rate
2.88%
Mortgage Type
New Conventional
Estimated Equity
$336,755
Purchase Details
Closed on
Oct 3, 2005
Sold by
Vogele Maureen L and Godshall Allan P
Bought by
Brun James H and Lyman Mary Karin
Home Financials for this Owner
Home Financials are based on the most recent Mortgage that was taken out on this home.
Original Mortgage
$872,000
Interest Rate
6.5%
Mortgage Type
Fannie Mae Freddie Mac
Purchase Details
Closed on
Apr 19, 1999
Sold by
John M Niehaus Inc
Bought by
Vogele Maureen L and Goodshall Allan P
Create a Home Valuation Report for This Property
The Home Valuation Report is an in-depth analysis detailing your home's value as well as a comparison with similar homes in the area
Home Values in the Area
Average Home Value in this Area
Purchase History
| Date | Buyer | Sale Price | Title Company |
|---|---|---|---|
| Sims Kimberly L | -- | None Available | |
| Hulette Kimberly L | $1,100,000 | -- | |
| Brun James H | -- | None Available | |
| Vogele Maureen L | $258,500 | -- |
Source: Public Records
Mortgage History
| Date | Status | Borrower | Loan Amount |
|---|---|---|---|
| Open | Hulette Kimberly L | $880,000 | |
| Previous Owner | Brun James H | $872,000 |
Source: Public Records
Tax History Compared to Growth
Tax History
| Year | Tax Paid | Tax Assessment Tax Assessment Total Assessment is a certain percentage of the fair market value that is determined by local assessors to be the total taxable value of land and additions on the property. | Land | Improvement |
|---|---|---|---|---|
| 2024 | $18,747 | $371,176 | $92,432 | $278,744 |
| 2023 | $18,832 | $371,176 | $92,432 | $278,744 |
| 2022 | $24,484 | $396,551 | $95,204 | $301,347 |
| 2021 | $23,908 | $396,551 | $95,204 | $301,347 |
| 2020 | $23,636 | $396,551 | $95,204 | $301,347 |
| 2019 | $23,864 | $385,001 | $92,432 | $292,569 |
| 2018 | $22,036 | $385,001 | $92,432 | $292,569 |
| 2017 | $22,199 | $385,001 | $92,432 | $292,569 |
| 2016 | $17,396 | $309,009 | $92,432 | $216,577 |
| 2015 | $17,566 | $309,009 | $92,432 | $216,577 |
| 2014 | $17,756 | $309,009 | $92,432 | $216,577 |
| 2013 | $17,840 | $309,009 | $92,432 | $216,577 |
Source: Public Records
Map
Nearby Homes
- 42 Edinburgh Place Unit 42
- 0 Saint Annes Unit 1826785
- 115 Fox Hills Ln
- 143 Fox Hills Ln
- 540 Aston View Ln
- 505 Aston View Ln
- 517 E State Rd
- 7284 W Harrison Ave
- 8735 Bridgetown Rd
- 21 Wamsley Ave
- 339 Sekitan Ave
- 101 E State Rd
- 3503 Chestnut Park Ln
- 143 Mount Nebo Rd
- 3498 Chestnut Park Ln
- 100 Mount Nebo Rd
- 118 Mount Nebo Rd
- 3889 Bear Ln
- 3623 Hazelnut Ct
- 110 Elliott St
- 13 St Andrews Dr
- 11 Saint Andrews Dr
- 15 Saint Andrews Dr
- 10 St Andrews
- 4 St Andrews
- 9 Saint Andrews Dr
- 2 Saint Andrews Dr
- 2 Saint Andrews Dr Unit Lt 2
- 17 Saint Andrews Dr
- 12 Saint Andrews Dr
- 7 Saint Andrews Dr
- 11 Abbey Hill
- 14 Saint Andrews Dr
- 16 Saint Andrews Dr
- 0 St Andrews Dr Unit 26 1333936
- 0 St Andrews Dr Unit 26 1367963
- 8 Saint Andrews Dr
- 0 St Andrews Dr Unit 26 1391486
- 18 St Andrews
- 18 Saint Andrews Dr