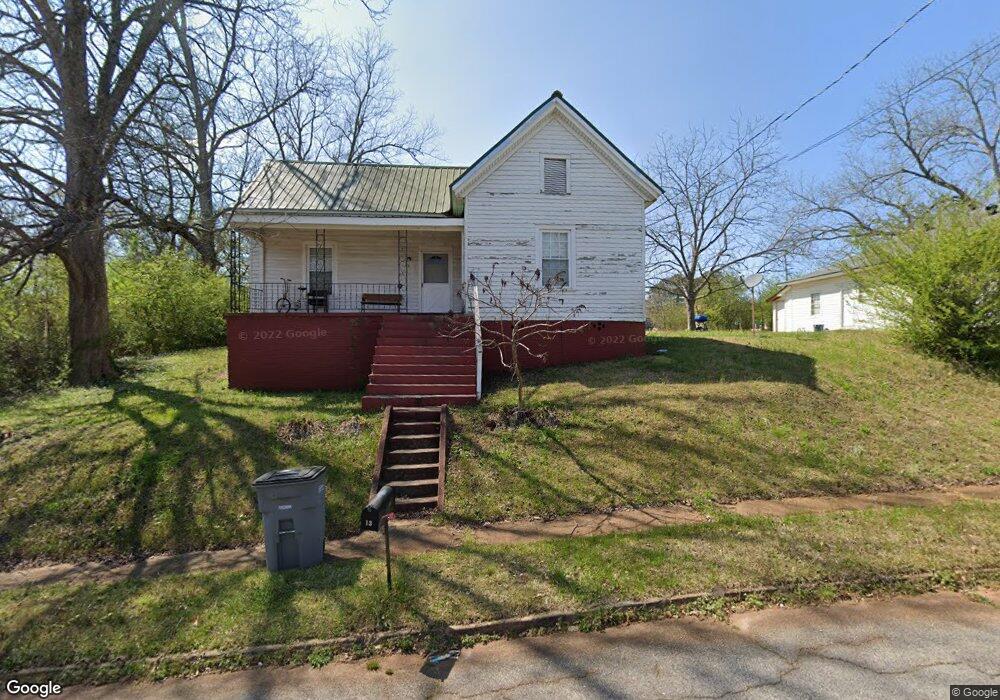
13 Sanford Ave Lagrange, GA 30241
Estimated Value: $76,000 - $115,000
2
Beds
1
Bath
1,188
Sq Ft
$79/Sq Ft
Est. Value
About This Home
This home is located at 13 Sanford Ave, Lagrange, GA 30241 and is currently estimated at $93,961, approximately $79 per square foot. 13 Sanford Ave is a home located in Troup County with nearby schools including Franklin Forest Elementary School, Hollis Hand Elementary School, and Ethel W. Kight Elementary School.
Ownership History
Date
Name
Owned For
Owner Type
Purchase Details
Closed on
May 31, 2018
Sold by
Blackwell Realty & Land
Bought by
Cruz Jose
Current Estimated Value
Home Financials for this Owner
Home Financials are based on the most recent Mortgage that was taken out on this home.
Original Mortgage
$32,811
Outstanding Balance
$6,129
Interest Rate
4.5%
Mortgage Type
New Conventional
Estimated Equity
$87,832
Purchase Details
Closed on
Mar 5, 2008
Sold by
Mckeen D Lamar
Bought by
Blackwell Realty & Land Hold
Purchase Details
Closed on
Feb 9, 1988
Sold by
Marlene Bass
Bought by
Lamar Mckeen D
Purchase Details
Closed on
Jul 26, 1984
Sold by
Moore Moore and Moore Hauck
Bought by
Marlene Bass
Purchase Details
Closed on
May 1, 1983
Sold by
Joel Yarbrough
Bought by
Moore Moore and Moore Hauck
Purchase Details
Closed on
Sep 23, 1969
Sold by
Schumacher Schumacher and Schumacher Arnsdorf
Purchase Details
Closed on
Aug 1, 1964
Sold by
Dunson Mills
Bought by
Schumacher Schumacher and Schumacher Arnsdorf
Create a Home Valuation Report for This Property
The Home Valuation Report is an in-depth analysis detailing your home's value as well as a comparison with similar homes in the area
Purchase History
| Date | Buyer | Sale Price | Title Company |
|---|---|---|---|
| Cruz Jose | $32,000 | -- | |
| Blackwell Realty & Land Hold | $10,000 | -- | |
| Lamar Mckeen D | $14,800 | -- | |
| Marlene Bass | -- | -- | |
| Moore Moore | -- | -- | |
| Joel Yarbrough | -- | -- | |
| -- | -- | -- | |
| Schumacher Schumacher | -- | -- |
Source: Public Records
Mortgage History
| Date | Status | Borrower | Loan Amount |
|---|---|---|---|
| Open | Cruz Jose | $32,811 |
Source: Public Records
Tax History
| Year | Tax Paid | Tax Assessment Tax Assessment Total Assessment is a certain percentage of the fair market value that is determined by local assessors to be the total taxable value of land and additions on the property. | Land | Improvement |
|---|---|---|---|---|
| 2025 | $756 | $27,720 | $5,320 | $22,400 |
| 2024 | $688 | $25,240 | $5,320 | $19,920 |
| 2023 | $537 | $19,680 | $5,320 | $14,360 |
| 2022 | $526 | $18,840 | $5,320 | $13,520 |
| 2021 | $423 | $14,040 | $2,640 | $11,400 |
| 2020 | $423 | $14,040 | $2,640 | $11,400 |
| 2019 | $386 | $15,080 | $2,640 | $12,440 |
| 2018 | $425 | $14,088 | $2,048 | $12,040 |
| 2017 | $425 | $14,088 | $2,048 | $12,040 |
| 2016 | $415 | $13,758 | $2,048 | $11,710 |
| 2015 | $416 | $13,758 | $2,048 | $11,710 |
| 2014 | $398 | $13,142 | $2,048 | $11,094 |
| 2013 | -- | $14,108 | $2,048 | $12,060 |
Source: Public Records
Map
Nearby Homes
- 3 Gulfstream Dr
- 5 Gulfstream Dr
- 0 N Barnard Ave
- 146 Shenandoah Ln
- 212 Cleveland Dr
- 204 Cleveland Dr
- 147 Shenandoah Ln
- 143 Shenandoah Ln
- 142 Shenandoah Ln
- 107 N Barnard Ave
- 304 Bridgette Blvd
- 141 Shenandoah Ln
- 412 Sweetwood Ct Unit A36
- 139 Shenandoah Ln
- 115 Clara Jean Ct
- 101 Sarah Ln
- 109 Sarah Ln
- 136 Shenandoah Ln
- 5 Curran Ave
- 110 Lenox Cir
Your Personal Tour Guide
Ask me questions while you tour the home.