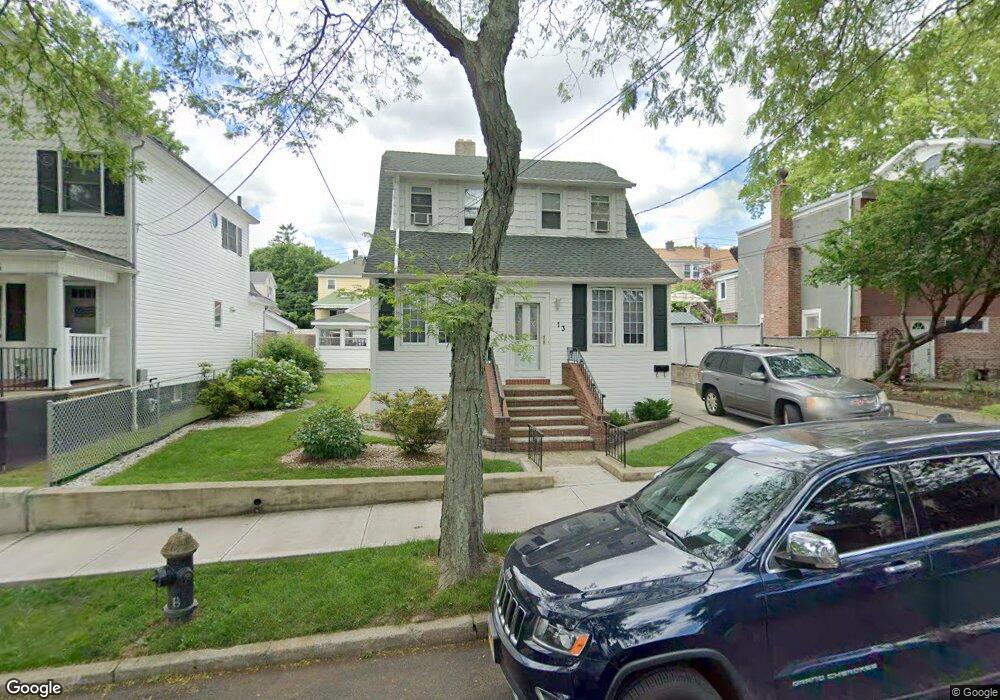
13 Savin Ct Staten Island, NY 10304
Dongan Hills NeighborhoodEstimated Value: $648,356 - $779,000
--
Bed
4
Baths
1,160
Sq Ft
$638/Sq Ft
Est. Value
About This Home
This home is located at 13 Savin Ct, Staten Island, NY 10304 and is currently estimated at $740,589, approximately $638 per square foot. 13 Savin Ct is a home located in Richmond County with nearby schools including P.S. 11 Thomas Dongan School, Is 2 George L Egbert, and New Dorp High School.
Ownership History
Date
Name
Owned For
Owner Type
Purchase Details
Closed on
Aug 13, 2019
Sold by
Link Diane and Kosanke Denise
Bought by
Link Diane and Link Andrew J
Current Estimated Value
Home Financials for this Owner
Home Financials are based on the most recent Mortgage that was taken out on this home.
Original Mortgage
$533,170
Outstanding Balance
$472,099
Interest Rate
4.25%
Mortgage Type
FHA
Estimated Equity
$268,490
Purchase Details
Closed on
Aug 12, 2008
Sold by
Link Diane
Bought by
Bisci Lillian
Home Financials for this Owner
Home Financials are based on the most recent Mortgage that was taken out on this home.
Original Mortgage
$505,000
Interest Rate
3.5%
Mortgage Type
Reverse Mortgage Home Equity Conversion Mortgage
Purchase Details
Closed on
Mar 17, 2003
Sold by
Bisci Lillian
Bought by
Bisci Lillian and Link Diane
Create a Home Valuation Report for This Property
The Home Valuation Report is an in-depth analysis detailing your home's value as well as a comparison with similar homes in the area
Home Values in the Area
Average Home Value in this Area
Purchase History
| Date | Buyer | Sale Price | Title Company |
|---|---|---|---|
| Link Diane | -- | M&L Land Svcs & Abstract Inc | |
| Bisci Lillian | -- | The Judicial Title Insurance | |
| Bisci Lillian | -- | Washington Title Insurance C |
Source: Public Records
Mortgage History
| Date | Status | Borrower | Loan Amount |
|---|---|---|---|
| Open | Link Diane | $533,170 | |
| Closed | Bisci Lillian | $505,000 |
Source: Public Records
Tax History Compared to Growth
Tax History
| Year | Tax Paid | Tax Assessment Tax Assessment Total Assessment is a certain percentage of the fair market value that is determined by local assessors to be the total taxable value of land and additions on the property. | Land | Improvement |
|---|---|---|---|---|
| 2025 | $3,834 | $39,540 | $11,764 | $27,776 |
| 2024 | $3,834 | $42,180 | $10,528 | $31,652 |
| 2023 | $3,492 | $31,596 | $9,411 | $22,185 |
| 2022 | $3,076 | $38,460 | $13,260 | $25,200 |
| 2021 | $3,121 | $36,180 | $13,260 | $22,920 |
| 2020 | $4,693 | $39,960 | $13,260 | $26,700 |
| 2019 | $5,179 | $37,560 | $13,260 | $24,300 |
| 2018 | $2,025 | $26,330 | $10,391 | $15,939 |
| 2017 | $1,886 | $24,840 | $13,260 | $11,580 |
| 2016 | $1,814 | $24,360 | $13,260 | $11,100 |
| 2015 | $1,778 | $25,545 | $10,152 | $15,393 |
| 2014 | $1,778 | $24,883 | $9,721 | $15,162 |
Source: Public Records
Map
Nearby Homes
- 41 Newberry Ave
- 1299 Richmond Rd
- 47 Vista Ave
- 1160 Richmond Rd Unit 7B
- 1160 Richmond Rd Unit 6A
- 1160 Richmond Rd Unit 2F
- 46 Durges St
- 32 Hunton St
- 2 Remsen St
- 83 Mountainside Rd
- 32 Remsen St
- 166 Providence St
- 16 Tacoma St
- 102 Burgher Ave
- 1373 Richmond Rd
- 78 Sparkill Ave
- 0 Hylan Blvd Unit 2405533
- 0 Hylan Blvd Unit 11348978
- 22 Scranton St
- 34 Bear St
- 15 Savin Ct
- 8 Old Town Rd
- 14 Old Town Rd
- 1248 Richmond Rd
- 1244 Richmond Rd
- 1250 Richmond Rd
- 17 Whitaker Place
- 25 Savin Ct
- 18 Savin Ct
- 24 Savin Ct
- 11 Whitaker Place
- 28 Savin Ct
- 10 Savin Ct
- 35 Whitaker Place
- 4 Savin Ct
- 12 Savin Ct
- 7 Whitaker Place
- 15 Old Town Rd Unit 2f
- 1220 Richmond Rd
- 1220 Richmond Rd Unit 1J