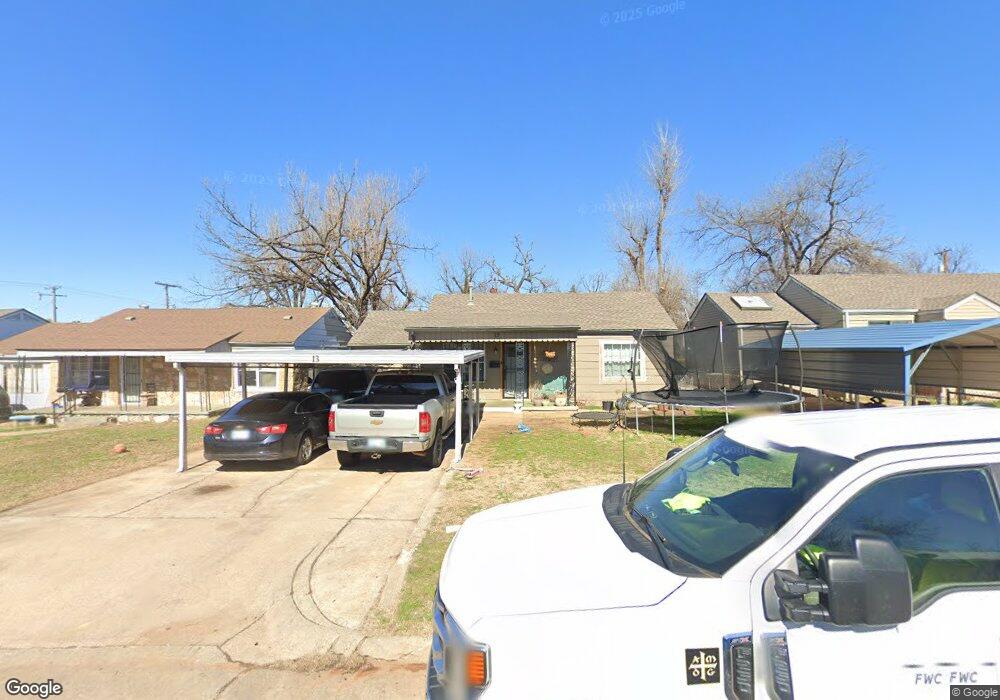
13 SE 37th St Oklahoma City, OK 73129
Oliver Park South NeighborhoodEstimated Value: $86,000 - $133,000
3
Beds
2
Baths
1,110
Sq Ft
$105/Sq Ft
Est. Value
About This Home
This home is located at 13 SE 37th St, Oklahoma City, OK 73129 and is currently estimated at $116,667, approximately $105 per square foot. 13 SE 37th St is a home located in Oklahoma County with nearby schools including César Chávez Elementary School, Wheeler Middle School, and Capitol Hill High School.
Ownership History
Date
Name
Owned For
Owner Type
Purchase Details
Closed on
Jul 9, 2019
Sold by
Mldk Services Llc
Bought by
Powers Investments Llc
Current Estimated Value
Home Financials for this Owner
Home Financials are based on the most recent Mortgage that was taken out on this home.
Original Mortgage
$48,750
Outstanding Balance
$42,709
Interest Rate
3.82%
Mortgage Type
Purchase Money Mortgage
Estimated Equity
$73,958
Purchase Details
Closed on
Apr 7, 2008
Sold by
Hague Dorothy D and Dorothy D Hague Revocable Trus
Bought by
Watson Mark E
Home Financials for this Owner
Home Financials are based on the most recent Mortgage that was taken out on this home.
Original Mortgage
$27,000
Interest Rate
6%
Mortgage Type
Purchase Money Mortgage
Create a Home Valuation Report for This Property
The Home Valuation Report is an in-depth analysis detailing your home's value as well as a comparison with similar homes in the area
Home Values in the Area
Average Home Value in this Area
Purchase History
| Date | Buyer | Sale Price | Title Company |
|---|---|---|---|
| Powers Investments Llc | $39,000 | Oklahoma City Abstract & Ttl | |
| Mldk Services Llc | $17,000 | Oklahoma City Abstract & Ttl | |
| Watson Mark E | $40,000 | Capitol Abstract & Title Co |
Source: Public Records
Mortgage History
| Date | Status | Borrower | Loan Amount |
|---|---|---|---|
| Open | Powers Investments Llc | $48,750 | |
| Previous Owner | Watson Mark E | $27,000 |
Source: Public Records
Tax History Compared to Growth
Tax History
| Year | Tax Paid | Tax Assessment Tax Assessment Total Assessment is a certain percentage of the fair market value that is determined by local assessors to be the total taxable value of land and additions on the property. | Land | Improvement |
|---|---|---|---|---|
| 2024 | $701 | $6,217 | $955 | $5,262 |
| 2023 | $701 | $5,920 | $1,028 | $4,892 |
| 2022 | $635 | $5,638 | $815 | $4,823 |
| 2021 | $603 | $5,370 | $906 | $4,464 |
| 2020 | $579 | $5,115 | $993 | $4,122 |
| 2019 | $577 | $5,115 | $993 | $4,122 |
| 2018 | $554 | $4,895 | $0 | $0 |
| 2017 | $547 | $4,839 | $993 | $3,846 |
| 2016 | $550 | $4,858 | $964 | $3,894 |
| 2015 | $529 | $4,626 | $967 | $3,659 |
| 2014 | $501 | $4,407 | $990 | $3,417 |
Source: Public Records
Map
Nearby Homes
- 3713 S Oklahoma Ave
- 116 SE 39th St
- 209 SW 40th St
- 109 SE 42nd St
- 1709 S Stiles Ave
- 0 SW 43rd St Unit Package of 3 Propert
- 212 SE 41st St
- 4113 S Harvey Ave
- 243 SE 41st St
- 3107 S Broadway Ave
- 312 SE 40th St
- 430 SE Grand Blvd
- 3215 S Harvey Ave
- 48 SE 45th St
- 400 SW 42nd St
- 227 SW 45th St
- 312 SE 45th St
- 628 SW 35th St
- 633 SE 39th St
- 617 SW 35th St