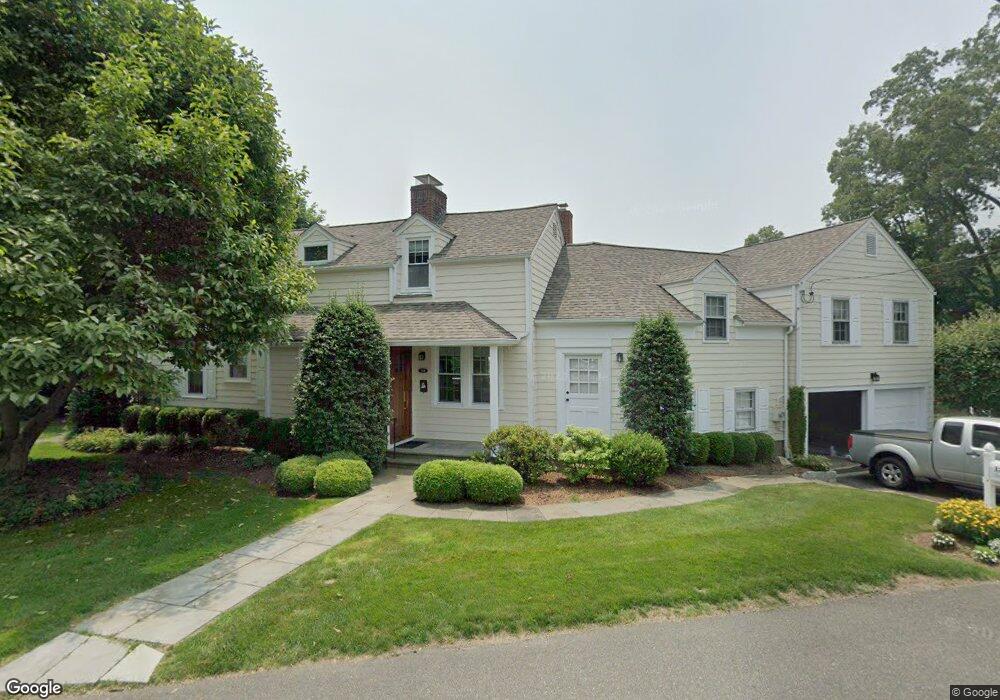
13 Seagate Rd Darien, CT 06820
Estimated Value: $2,601,367 - $2,994,000
4
Beds
4
Baths
3,339
Sq Ft
$828/Sq Ft
Est. Value
About This Home
This home is located at 13 Seagate Rd, Darien, CT 06820 and is currently estimated at $2,766,342, approximately $828 per square foot. 13 Seagate Rd is a home located in Fairfield County with nearby schools including Hindley Elementary School, Middlesex Middle School, and Darien High School.
Ownership History
Date
Name
Owned For
Owner Type
Purchase Details
Closed on
Mar 6, 2017
Sold by
Bassler Sara
Bought by
Bassler John
Current Estimated Value
Purchase Details
Closed on
Jun 8, 1999
Sold by
Lange Paul R and Lange Barbara K
Bought by
Bassler Sara A
Home Financials for this Owner
Home Financials are based on the most recent Mortgage that was taken out on this home.
Original Mortgage
$240,000
Interest Rate
6.85%
Mortgage Type
Purchase Money Mortgage
Create a Home Valuation Report for This Property
The Home Valuation Report is an in-depth analysis detailing your home's value as well as a comparison with similar homes in the area
Home Values in the Area
Average Home Value in this Area
Purchase History
| Date | Buyer | Sale Price | Title Company |
|---|---|---|---|
| Bassler John | -- | -- | |
| Bassler Sara A | $1,100,000 | -- |
Source: Public Records
Mortgage History
| Date | Status | Borrower | Loan Amount |
|---|---|---|---|
| Previous Owner | Bassler Sara A | $240,000 |
Source: Public Records
Tax History
| Year | Tax Paid | Tax Assessment Tax Assessment Total Assessment is a certain percentage of the fair market value that is determined by local assessors to be the total taxable value of land and additions on the property. | Land | Improvement |
|---|---|---|---|---|
| 2025 | $18,534 | $1,197,280 | $897,120 | $300,160 |
| 2024 | $17,588 | $1,197,280 | $897,120 | $300,160 |
| 2023 | $16,496 | $936,740 | $668,640 | $268,100 |
| 2022 | $16,140 | $936,740 | $668,640 | $268,100 |
| 2021 | $15,775 | $936,740 | $668,640 | $268,100 |
| 2020 | $15,325 | $936,740 | $668,640 | $268,100 |
| 2019 | $188,328 | $936,740 | $668,640 | $268,100 |
| 2018 | $18,050 | $1,122,520 | $776,440 | $346,080 |
| 2017 | $232,807 | $1,122,520 | $776,440 | $346,080 |
| 2016 | $17,702 | $1,122,520 | $776,440 | $346,080 |
| 2015 | $17,231 | $1,122,520 | $776,440 | $346,080 |
| 2014 | $16,849 | $1,122,520 | $776,440 | $346,080 |
Source: Public Records
Map
Nearby Homes
- 20 Outlook Dr
- 23 Beach Dr
- 3 Salt Box Ln E
- 66 Stanton Rd
- 25 Hillside Ave
- 18 Pasture Ln
- 32 Relihan Rd
- 12 Walmsley Rd
- 29 Waterbury Ave
- 77 Maple St
- 33 Dora St
- 221 Sylvan Knoll Rd
- 171 Sylvan Knoll Rd
- 163 Sylvan Knoll Rd
- 7 Dora St Unit 7
- 104 Sylvan Knoll Rd
- 274 Sylvan Knoll Rd
- 24 King St
- 11 Patton Dr
- 421 Sylvan Knoll Rd
Your Personal Tour Guide
Ask me questions while you tour the home.