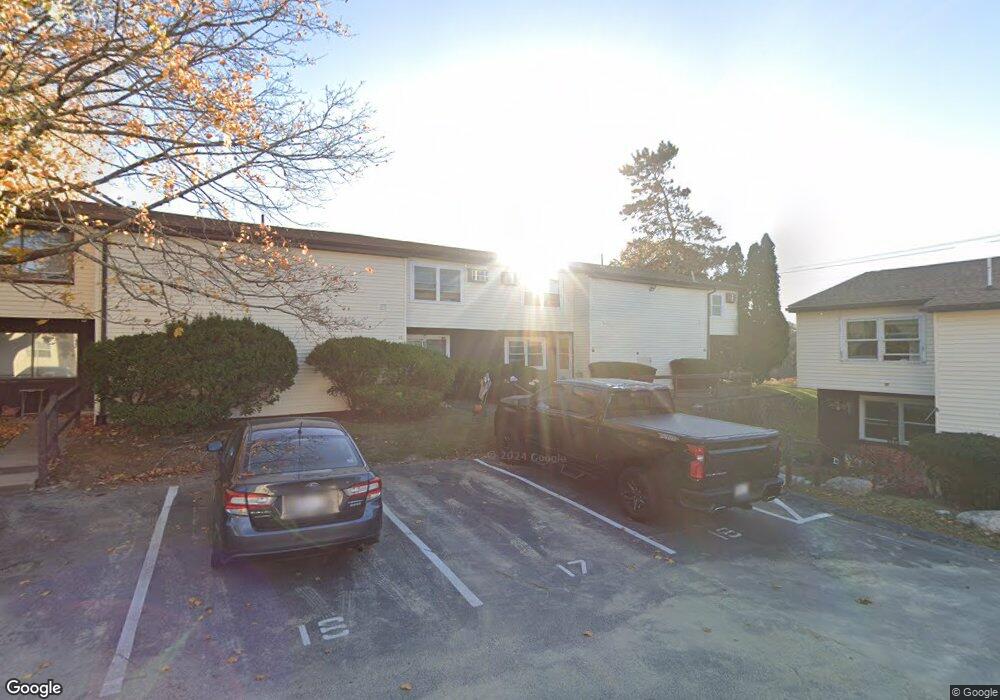
13 Senee Ct Amesbury, MA 01913
Estimated Value: $331,000 - $338,000
3
Beds
2
Baths
1,190
Sq Ft
$281/Sq Ft
Est. Value
About This Home
This home is located at 13 Senee Ct, Amesbury, MA 01913 and is currently estimated at $334,626, approximately $281 per square foot. 13 Senee Ct is a home located in Essex County with nearby schools including Amesbury High School and Amesbury Seventh-Day Adventist School.
Ownership History
Date
Name
Owned For
Owner Type
Purchase Details
Closed on
Jul 29, 2010
Sold by
Pelletier Andrew P
Bought by
Winters Dawnmarie P and Winters Laraine
Current Estimated Value
Home Financials for this Owner
Home Financials are based on the most recent Mortgage that was taken out on this home.
Original Mortgage
$27,000
Interest Rate
4.78%
Mortgage Type
Purchase Money Mortgage
Purchase Details
Closed on
Jul 15, 2005
Sold by
Maguire Joan M
Bought by
Pelletier Andrew
Home Financials for this Owner
Home Financials are based on the most recent Mortgage that was taken out on this home.
Original Mortgage
$142,400
Interest Rate
5.67%
Mortgage Type
Purchase Money Mortgage
Purchase Details
Closed on
Jan 7, 2004
Sold by
Vincent Diana J and Vincent Thomas A
Bought by
Maguire Joan M
Purchase Details
Closed on
Oct 24, 2000
Sold by
Pass Daniel
Bought by
Vincent Thomas A and Vincent Diana J
Purchase Details
Closed on
Nov 20, 1998
Sold by
R&R Rt and Moody Richard B
Bought by
Pass Daniel
Create a Home Valuation Report for This Property
The Home Valuation Report is an in-depth analysis detailing your home's value as well as a comparison with similar homes in the area
Home Values in the Area
Average Home Value in this Area
Purchase History
| Date | Buyer | Sale Price | Title Company |
|---|---|---|---|
| Winters Dawnmarie P | $67,000 | -- | |
| Pelletier Andrew | $178,000 | -- | |
| Maguire Joan M | $154,000 | -- | |
| Vincent Thomas A | $85,000 | -- | |
| Pass Daniel | $50,000 | -- |
Source: Public Records
Mortgage History
| Date | Status | Borrower | Loan Amount |
|---|---|---|---|
| Open | Pass Daniel | $30,500 | |
| Closed | Pass Daniel | $27,000 | |
| Previous Owner | Pass Daniel | $142,400 |
Source: Public Records
Tax History
| Year | Tax Paid | Tax Assessment Tax Assessment Total Assessment is a certain percentage of the fair market value that is determined by local assessors to be the total taxable value of land and additions on the property. | Land | Improvement |
|---|---|---|---|---|
| 2025 | $4,474 | $292,400 | $0 | $292,400 |
| 2024 | $4,049 | $258,900 | $0 | $258,900 |
| 2023 | $3,459 | $211,700 | $0 | $211,700 |
| 2022 | $3,248 | $183,600 | $0 | $183,600 |
| 2021 | $2,898 | $158,800 | $0 | $158,800 |
| 2020 | $2,706 | $157,500 | $0 | $157,500 |
| 2019 | $5,504 | $141,200 | $0 | $141,200 |
| 2018 | $2,767 | $145,700 | $0 | $145,700 |
| 2017 | $1,776 | $89,000 | $0 | $89,000 |
| 2016 | $1,766 | $87,100 | $0 | $87,100 |
| 2015 | $1,257 | $61,200 | $0 | $61,200 |
| 2014 | $1,390 | $66,300 | $0 | $66,300 |
Source: Public Records
Map
Nearby Homes
- 20 Mason Ct
- 39 Unicorn Cir
- 12 Locke Hill Ln
- 25 Whittier Meadows Dr
- 48 Orchard St
- 19 Maple St Unit 21
- 3 Tremont Ave Unit A
- 27 Lake St
- 5 Tuxbury Ln
- 8 Winter St
- 149 Market St
- 5 Russell St Unit 1
- 101 Market St Unit B
- 4 Boardman St
- 20 Lincoln Ct
- 25 Cedar St Unit 4
- 4 Larnard Ct
- 1 Hillside Ave Unit 3
- 152 Kimball Rd
- 97 Elm St
Your Personal Tour Guide
Ask me questions while you tour the home.