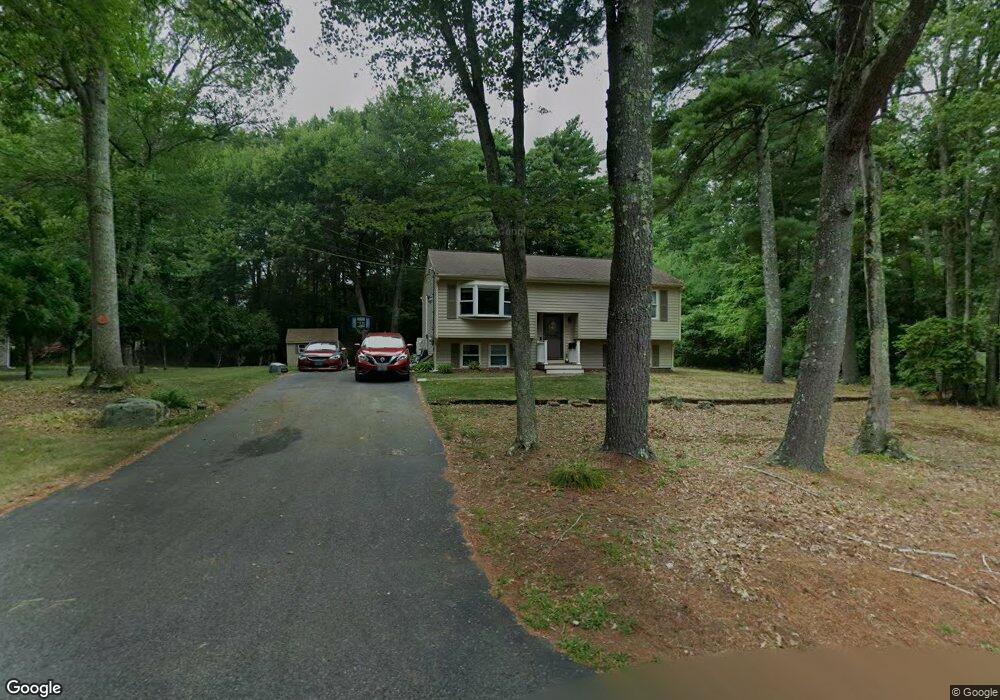
13 Seymour St Berkley, MA 02779
Estimated Value: $454,175 - $576,000
2
Beds
1
Bath
936
Sq Ft
$528/Sq Ft
Est. Value
About This Home
This home is located at 13 Seymour St, Berkley, MA 02779 and is currently estimated at $493,794, approximately $527 per square foot. 13 Seymour St is a home located in Bristol County with nearby schools including Berkley Community School.
Ownership History
Date
Name
Owned For
Owner Type
Purchase Details
Closed on
Jun 10, 2024
Sold by
Goyette Kristine L
Bought by
Bagge
Current Estimated Value
Purchase Details
Closed on
Jan 23, 1997
Sold by
Silva Nancy L
Bought by
Goyette Kristine L
Home Financials for this Owner
Home Financials are based on the most recent Mortgage that was taken out on this home.
Original Mortgage
$101,000
Interest Rate
7.5%
Mortgage Type
Purchase Money Mortgage
Purchase Details
Closed on
Sep 29, 1995
Sold by
Paice Scott G and Paice Samara D
Bought by
Silva Joseph L and Silva Nancy L
Purchase Details
Closed on
Dec 27, 1990
Sold by
Murray Edward J
Bought by
Paice Scott G
Create a Home Valuation Report for This Property
The Home Valuation Report is an in-depth analysis detailing your home's value as well as a comparison with similar homes in the area
Home Values in the Area
Average Home Value in this Area
Purchase History
| Date | Buyer | Sale Price | Title Company |
|---|---|---|---|
| Bagge | -- | None Available | |
| Bagge | -- | None Available | |
| Goyette Kristine L | $136,000 | -- | |
| Silva Joseph L | $126,000 | -- | |
| Paice Scott G | $122,050 | -- | |
| Goyette Kristine L | $136,000 | -- | |
| Silva Joseph L | $126,000 | -- | |
| Paice Scott G | $122,050 | -- |
Source: Public Records
Mortgage History
| Date | Status | Borrower | Loan Amount |
|---|---|---|---|
| Previous Owner | Paice Scott G | $20,000 | |
| Previous Owner | Paice Scott G | $101,000 |
Source: Public Records
Tax History Compared to Growth
Tax History
| Year | Tax Paid | Tax Assessment Tax Assessment Total Assessment is a certain percentage of the fair market value that is determined by local assessors to be the total taxable value of land and additions on the property. | Land | Improvement |
|---|---|---|---|---|
| 2025 | $42 | $353,400 | $109,800 | $243,600 |
| 2024 | $4,061 | $326,200 | $94,600 | $231,600 |
| 2023 | $3,975 | $300,700 | $94,600 | $206,100 |
| 2022 | $3,867 | $281,200 | $82,200 | $199,000 |
| 2021 | $3,760 | $263,300 | $78,300 | $185,000 |
| 2020 | $3,685 | $253,600 | $69,300 | $184,300 |
| 2019 | $3,581 | $244,600 | $69,300 | $175,300 |
| 2018 | $3,279 | $233,900 | $66,600 | $167,300 |
| 2017 | $3,195 | $223,400 | $74,700 | $148,700 |
| 2016 | $3,084 | $207,800 | $74,700 | $133,100 |
| 2015 | $2,920 | $209,900 | $74,700 | $135,200 |
| 2014 | $2,790 | $217,800 | $81,000 | $136,800 |
Source: Public Records
Map
Nearby Homes