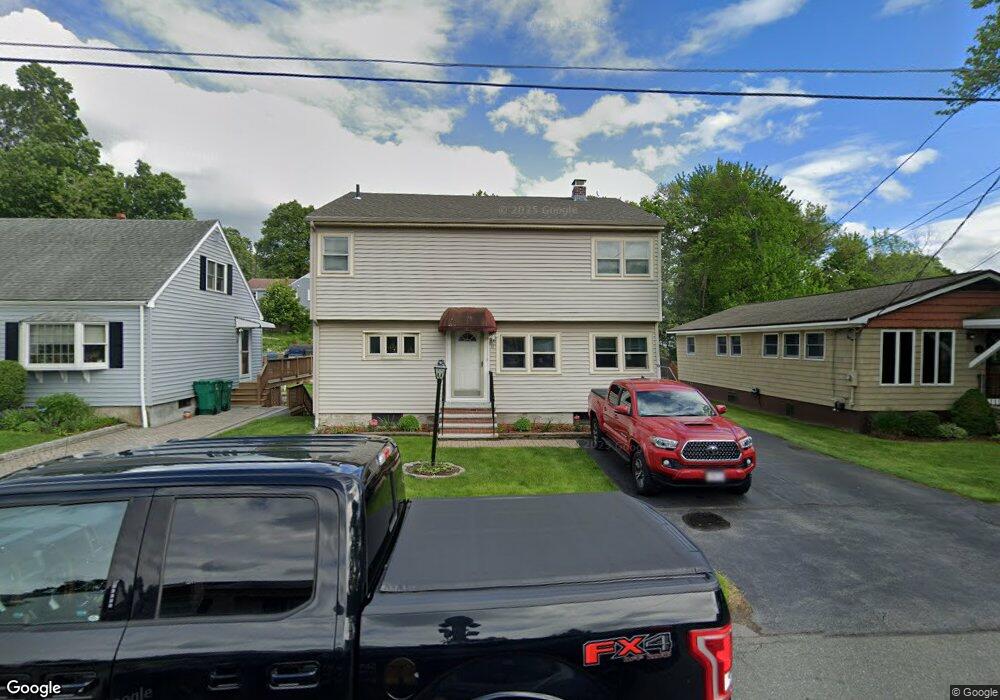
13 Shady Ln Lynn, MA 01905
Upper Walnut Street NeighborhoodEstimated Value: $732,660 - $843,000
4
Beds
2
Baths
2,120
Sq Ft
$364/Sq Ft
Est. Value
About This Home
This home is located at 13 Shady Ln, Lynn, MA 01905 and is currently estimated at $770,915, approximately $363 per square foot. 13 Shady Ln is a home located in Essex County with nearby schools including Julia F. Callahan Elementary School, William R. Fallon School, and Breed Middle School.
Ownership History
Date
Name
Owned For
Owner Type
Purchase Details
Closed on
Oct 7, 2010
Sold by
Olofson Richard
Bought by
Sou Sokha D and Kim Alicia
Current Estimated Value
Home Financials for this Owner
Home Financials are based on the most recent Mortgage that was taken out on this home.
Original Mortgage
$260,000
Outstanding Balance
$171,747
Interest Rate
4.37%
Mortgage Type
Purchase Money Mortgage
Estimated Equity
$599,168
Create a Home Valuation Report for This Property
The Home Valuation Report is an in-depth analysis detailing your home's value as well as a comparison with similar homes in the area
Home Values in the Area
Average Home Value in this Area
Purchase History
We collect this data history from publicly available records. To have your information removed, we recommend requesting removal directly through your county’s website.
| Date | Buyer | Sale Price | Title Company |
|---|---|---|---|
| Sou Sokha D | $325,000 | -- | |
| Sou Sokha D | $325,000 | -- |
Source: Public Records
Mortgage History
We collect this data history from publicly available records. To have your information removed, we recommend requesting removal directly through your county’s website.
| Date | Status | Borrower | Loan Amount |
|---|---|---|---|
| Open | Sou Sokha D | $260,000 | |
| Closed | Sou Sokha D | $260,000 | |
| Previous Owner | Sou Sokha D | $150,000 |
Source: Public Records
Tax History
| Year | Tax Paid | Tax Assessment Tax Assessment Total Assessment is a certain percentage of the fair market value that is determined by local assessors to be the total taxable value of land and additions on the property. | Land | Improvement |
|---|---|---|---|---|
| 2025 | $7,425 | $716,700 | $207,500 | $509,200 |
| 2024 | $7,038 | $668,400 | $206,200 | $462,200 |
| 2023 | $6,696 | $600,500 | $190,300 | $410,200 |
| 2022 | $6,716 | $540,300 | $171,300 | $369,000 |
| 2021 | $6,342 | $486,700 | $159,500 | $327,200 |
| 2020 | $6,114 | $456,300 | $141,800 | $314,500 |
| 2019 | $6,249 | $437,000 | $145,900 | $291,100 |
| 2018 | $5,963 | $393,600 | $136,400 | $257,200 |
| 2017 | $5,405 | $346,500 | $118,300 | $228,200 |
| 2016 | $5,294 | $327,200 | $111,900 | $215,300 |
| 2015 | $5,139 | $306,800 | $110,600 | $196,200 |
Source: Public Records
Map
Nearby Homes
- 32 Birch Brook Rd Unit 27
- 32 Birch Brook Rd Unit 28
- 32 Birch Brook Landing Unit 9
- 32 Birch Brook Landing Unit 25
- 32 Birch Brook Landing Unit 11
- 32 Birch Brook Landing Unit 4
- 53 Dungeon Ave
- 36 Stiles St
- 74 Myrtle St
- 56 Gardiner St
- 86 Farrell Rd
- 47 Myrtle St
- 82 Linwood St
- 74 Linwood St
- 15 Perley St
- 1 Twin Springs Dr
- 11 Willis Ct
- 4 Oneil Way
- 12 Bisbee Rd
- 15 Flint St
Your Personal Tour Guide
Ask me questions while you tour the home.