13 Skyline Dr Warren, NJ 07059
Estimated Value: $923,000 - $1,078,000
Studio
--
Bath
1,885
Sq Ft
$525/Sq Ft
Est. Value
About This Home
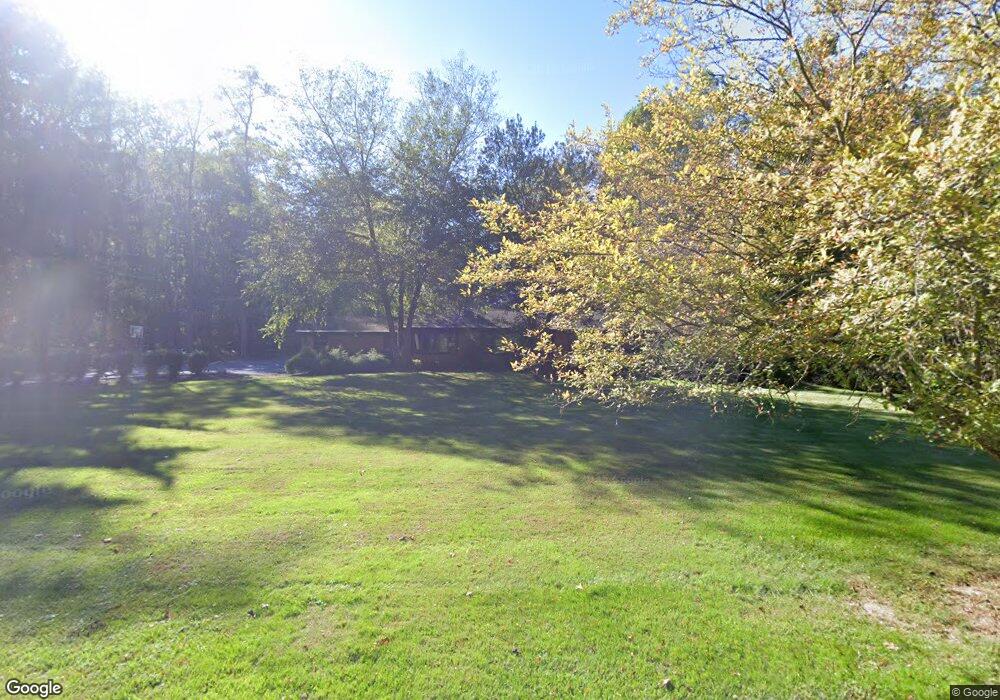
This home is located at 13 Skyline Dr, Warren, NJ 07059 and is currently estimated at $989,997, approximately $525 per square foot. 13 Skyline Dr is a home located in Somerset County with nearby schools including Mt. Horeb School, Warren Middle School, and Watchung Hills Regional High School.
Ownership History
Date
Name
Owned For
Owner Type
Purchase Details
Closed on
Jun 21, 2023
Sold by
Fernandez Paul and Aibsel Coromoto
Bought by
Fernandez Paul and Fernandez Aibsel Coromoto
Current Estimated Value
Home Financials for this Owner
Home Financials are based on the most recent Mortgage that was taken out on this home.
Original Mortgage
$449,735
Outstanding Balance
$437,621
Interest Rate
6.35%
Mortgage Type
FHA
Estimated Equity
$552,376
Purchase Details
Closed on
Nov 6, 2008
Sold by
Rumphrey Robert E and Rumphrey Toni L
Bought by
Fernandez Paul and Fernandez Aibsel
Home Financials for this Owner
Home Financials are based on the most recent Mortgage that was taken out on this home.
Original Mortgage
$520,000
Interest Rate
6.37%
Mortgage Type
Purchase Money Mortgage
Purchase Details
Closed on
May 5, 1995
Sold by
Bercaw Joe
Bought by
Rumphrey Robert and Peterson Toni
Create a Home Valuation Report for This Property
The Home Valuation Report is an in-depth analysis detailing your home's value as well as a comparison with similar homes in the area
Home Values in the Area
Average Home Value in this Area
Purchase History
| Date | Buyer | Sale Price | Title Company |
|---|---|---|---|
| Fernandez Paul | -- | None Listed On Document | |
| Fernandez Paul | -- | None Listed On Document | |
| Fernandez Paul | $650,000 | None Available | |
| Rumphrey Robert | $391,000 | -- |
Source: Public Records
Mortgage History
| Date | Status | Borrower | Loan Amount |
|---|---|---|---|
| Open | Fernandez Paul | $449,735 | |
| Closed | Fernandez Paul | $449,735 | |
| Previous Owner | Fernandez Paul | $520,000 |
Source: Public Records
Tax History
| Year | Tax Paid | Tax Assessment Tax Assessment Total Assessment is a certain percentage of the fair market value that is determined by local assessors to be the total taxable value of land and additions on the property. | Land | Improvement |
|---|---|---|---|---|
| 2025 | $13,950 | $834,100 | $514,900 | $319,200 |
| 2024 | $13,950 | $759,000 | $462,800 | $296,200 |
| 2023 | $13,595 | $701,500 | $424,500 | $277,000 |
| 2022 | $13,402 | $674,500 | $408,900 | $265,600 |
| 2021 | $13,517 | $651,100 | $393,200 | $257,900 |
| 2020 | $13,277 | $641,400 | $387,300 | $254,100 |
| 2019 | $13,400 | $657,500 | $403,400 | $254,100 |
| 2018 | $12,641 | $636,200 | $387,800 | $248,400 |
| 2017 | $12,097 | $608,500 | $352,500 | $256,000 |
| 2016 | $12,006 | $597,600 | $345,500 | $252,100 |
| 2015 | $11,610 | $566,900 | $320,600 | $246,300 |
| 2014 | $11,144 | $547,100 | $320,600 | $226,500 |
Source: Public Records
Map
Nearby Homes
- 21 Angus Ln
- 6 Stonehedge Ct
- 7 Nottingham Way
- 10 Blazier Rd
- 6 Elm Ave
- 27 Elm Ave
- 29 Elm Ave
- 5 2nd St
- 7 Tower Rd
- 14 9th St
- 59 Ferguson Rd
- 120-122 Mountainview Rd
- 3 Concord Ct
- 11 Concord Ct
- 7 Manor Dr
- 1899 Washington Valley Rd
- 2017 Washington Valley Rd
- 2 Willow Woods Trail
- 2044 Washington Valley Rd
- 112 King George Rd
Your Personal Tour Guide
Ask me questions while you tour the home.