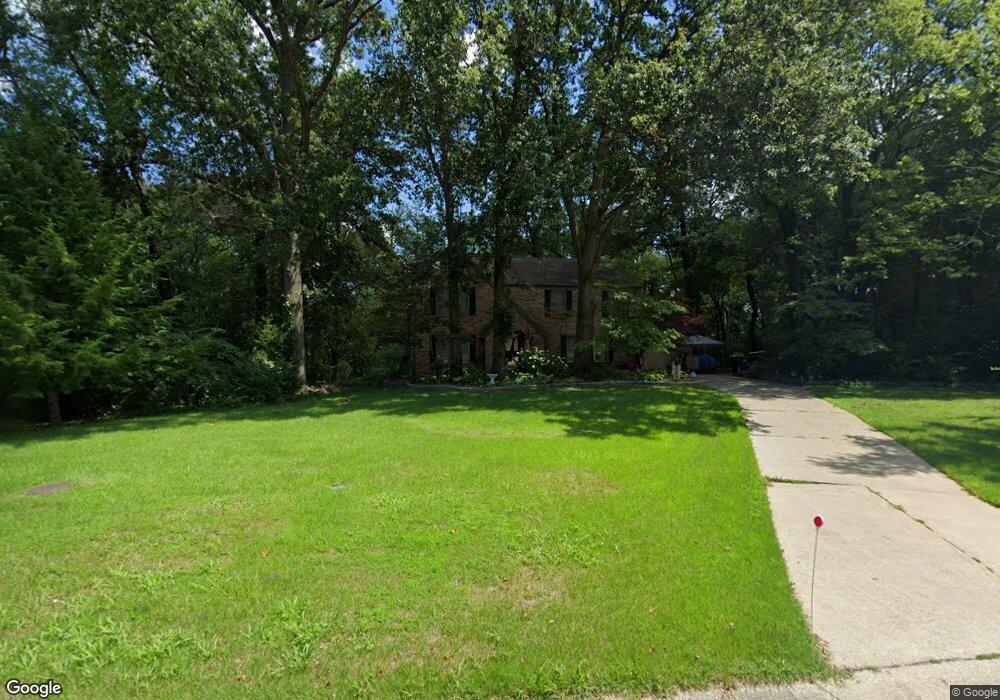
13 St Joseph Lebanon, IL 62254
Estimated Value: $296,000 - $308,860
4
Beds
3
Baths
2,700
Sq Ft
$112/Sq Ft
Est. Value
About This Home
This home is located at 13 St Joseph, Lebanon, IL 62254 and is currently estimated at $302,215, approximately $111 per square foot. 13 St Joseph is a home located in St. Clair County with nearby schools including Lebanon Elementary School and Lebanon High School.
Ownership History
Date
Name
Owned For
Owner Type
Purchase Details
Closed on
Oct 20, 2021
Sold by
Gordon Smith Debra A and Gordon Smith Debra
Bought by
Gordon Smith Debra Ann and Scheel Crissa Lynne
Current Estimated Value
Home Financials for this Owner
Home Financials are based on the most recent Mortgage that was taken out on this home.
Original Mortgage
$173,000
Outstanding Balance
$132,940
Interest Rate
2.1%
Mortgage Type
New Conventional
Estimated Equity
$169,275
Purchase Details
Closed on
May 12, 2017
Sold by
Schultz Sarah J Daniels
Bought by
Gordon Smith Debra A
Home Financials for this Owner
Home Financials are based on the most recent Mortgage that was taken out on this home.
Original Mortgage
$189,504
Interest Rate
3.75%
Mortgage Type
FHA
Purchase Details
Closed on
May 2, 2013
Sold by
Sampson Ronald T and Sampson Jill
Bought by
Shultz Sarah J Daniels
Home Financials for this Owner
Home Financials are based on the most recent Mortgage that was taken out on this home.
Original Mortgage
$178,000
Interest Rate
3.25%
Mortgage Type
VA
Create a Home Valuation Report for This Property
The Home Valuation Report is an in-depth analysis detailing your home's value as well as a comparison with similar homes in the area
Home Values in the Area
Average Home Value in this Area
Purchase History
| Date | Buyer | Sale Price | Title Company |
|---|---|---|---|
| Gordon Smith Debra Ann | -- | Orange Coast Lender Services | |
| Gordon Smith Debra A | $193,000 | Fatic | |
| Shultz Sarah J Daniels | $178,000 | Fatic |
Source: Public Records
Mortgage History
| Date | Status | Borrower | Loan Amount |
|---|---|---|---|
| Open | Gordon Smith Debra Ann | $173,000 | |
| Closed | Gordon Smith Debra A | $189,504 | |
| Previous Owner | Shultz Sarah J Daniels | $178,000 |
Source: Public Records
Tax History Compared to Growth
Tax History
| Year | Tax Paid | Tax Assessment Tax Assessment Total Assessment is a certain percentage of the fair market value that is determined by local assessors to be the total taxable value of land and additions on the property. | Land | Improvement |
|---|---|---|---|---|
| 2024 | $6,500 | $82,237 | $15,079 | $67,158 |
| 2023 | $6,285 | $78,150 | $14,330 | $63,820 |
| 2022 | $5,935 | $72,847 | $13,358 | $59,489 |
| 2021 | $6,165 | $70,966 | $13,013 | $57,953 |
| 2020 | $5,954 | $64,460 | $11,820 | $52,640 |
| 2019 | $5,727 | $64,460 | $11,820 | $52,640 |
| 2018 | $5,508 | $62,546 | $11,469 | $51,077 |
| 2017 | $0 | $60,637 | $11,904 | $48,733 |
| 2016 | $0 | $60,156 | $11,810 | $48,346 |
| 2014 | $4,384 | $58,110 | $11,408 | $46,702 |
| 2013 | $5,960 | $75,167 | $11,834 | $63,333 |
Source: Public Records
Map
Nearby Homes
- 19 Saint Joseph Dr
- 405 Acorn Way
- 10904 Upland Terrace Dr
- 614 N Monroe St
- 703 N Pearl St
- 1105 Anna Ct
- 10909 Kentfield Dr
- 10962 Kentfield Dr
- 213 McKendree Park Rd
- 207 Hunter St
- 0 College Rd
- 213 N Monroe St
- 227 Roosevelt St
- 214 Roosevelt St
- 1011 Belleville St
- 1101 Belleville St
- 218 N Herman St
- 0 Belleville St
- 214 E Main St
- 216 E Main St
- 13 Saint Joseph Dr
- 15 Saint Joseph Dr
- 11 Saint Joseph Dr
- 6 Saint Joseph Dr
- 5 Saint Joseph Dr
- 7 Saint Joseph Dr
- 4 Saint Joseph Dr
- 16 Saint Joseph Dr
- 10 Saint Joseph Dr
- 8 Saint Joseph Dr
- 3 St Joseph
- 3 Saint Joseph Dr
- 17 Saint Joseph Dr
- 52 Harmon Dr
- 54 Harmon Dr
- 708 Hillcrest Dr
- 9 Saint Joseph Dr
- 51 Harmon Dr
- 50 Harmon Dr
- 18 Saint Joseph Dr