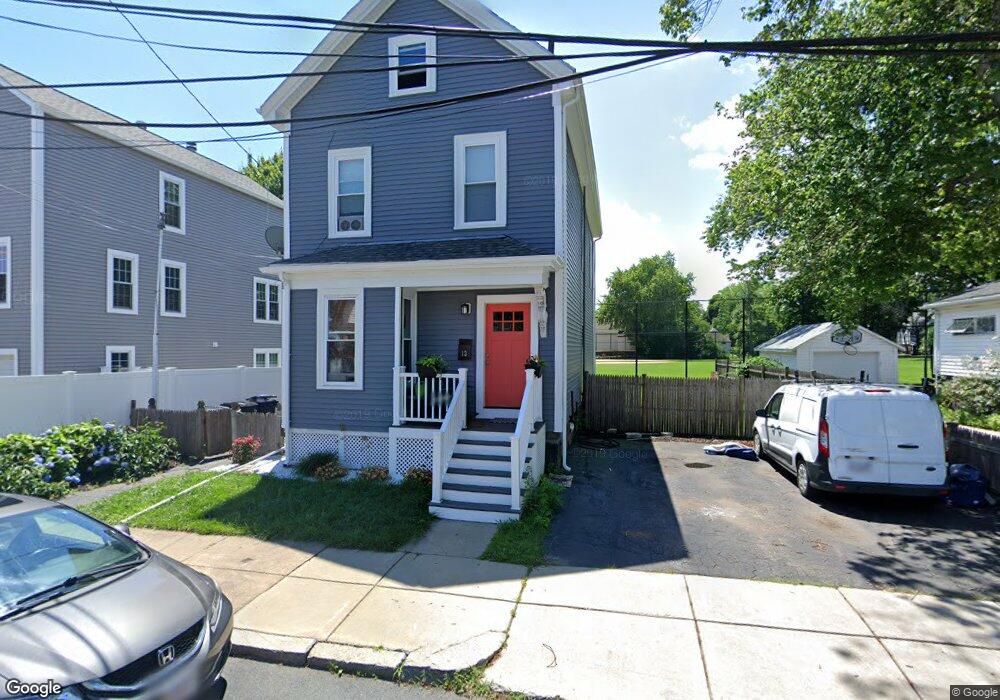
13 Stock St Dorchester, MA 02122
Lower Mills NeighborhoodEstimated Value: $643,000 - $872,000
4
Beds
2
Baths
1,750
Sq Ft
$439/Sq Ft
Est. Value
About This Home
This home is located at 13 Stock St, Dorchester, MA 02122 and is currently estimated at $768,905, approximately $439 per square foot. 13 Stock St is a home located in Suffolk County with nearby schools including Neighborhood House Charter School, Conservatory Lab Upper School, and St Brendan School.
Ownership History
Date
Name
Owned For
Owner Type
Purchase Details
Closed on
Jul 28, 2009
Sold by
Long Annie E
Bought by
Newell Kirsten M and Newell Aiden P
Current Estimated Value
Home Financials for this Owner
Home Financials are based on the most recent Mortgage that was taken out on this home.
Original Mortgage
$293,548
Outstanding Balance
$194,975
Interest Rate
5.58%
Mortgage Type
Purchase Money Mortgage
Estimated Equity
$573,931
Create a Home Valuation Report for This Property
The Home Valuation Report is an in-depth analysis detailing your home's value as well as a comparison with similar homes in the area
Home Values in the Area
Average Home Value in this Area
Purchase History
| Date | Buyer | Sale Price | Title Company |
|---|---|---|---|
| Newell Kirsten M | $299,000 | -- |
Source: Public Records
Mortgage History
| Date | Status | Borrower | Loan Amount |
|---|---|---|---|
| Open | Newell Kirsten M | $293,548 |
Source: Public Records
Tax History Compared to Growth
Tax History
| Year | Tax Paid | Tax Assessment Tax Assessment Total Assessment is a certain percentage of the fair market value that is determined by local assessors to be the total taxable value of land and additions on the property. | Land | Improvement |
|---|---|---|---|---|
| 2025 | $7,195 | $621,300 | $272,000 | $349,300 |
| 2024 | $6,965 | $639,000 | $234,700 | $404,300 |
| 2023 | $6,415 | $597,300 | $219,400 | $377,900 |
| 2022 | $6,249 | $574,400 | $211,000 | $363,400 |
| 2021 | $5,705 | $534,700 | $200,900 | $333,800 |
| 2020 | $5,220 | $494,300 | $180,300 | $314,000 |
| 2019 | $4,836 | $458,800 | $140,300 | $318,500 |
| 2018 | $4,412 | $421,000 | $140,300 | $280,700 |
| 2017 | $4,246 | $400,900 | $140,300 | $260,600 |
| 2016 | $4,083 | $371,200 | $140,300 | $230,900 |
| 2015 | $3,565 | $294,400 | $126,100 | $168,300 |
| 2014 | $3,633 | $288,800 | $126,100 | $162,700 |
Source: Public Records
Map
Nearby Homes
- 103 Minot St
- 45 Chickatawbut St Unit 1
- 107 Minot St
- 43 Chickatawbut St
- 140 Minot St
- 378 Neponset Ave
- 400-412 Neponset Ave
- 51 Coffey St Unit 51C
- 56 Coffey St Unit 10
- 701 Adams St Unit 9
- 61 Hill Top St
- 118-120 Granite Ave Unit 2
- 36 Mckone St Unit 2
- 36 Mckone St
- 36 Mckone St Unit 1
- 33 Westmoreland St
- 37 Westmoreland St
- 80 Beaumont St Unit 101
- 40 Westmoreland St Unit 8
- 62 Redfield St Unit 1