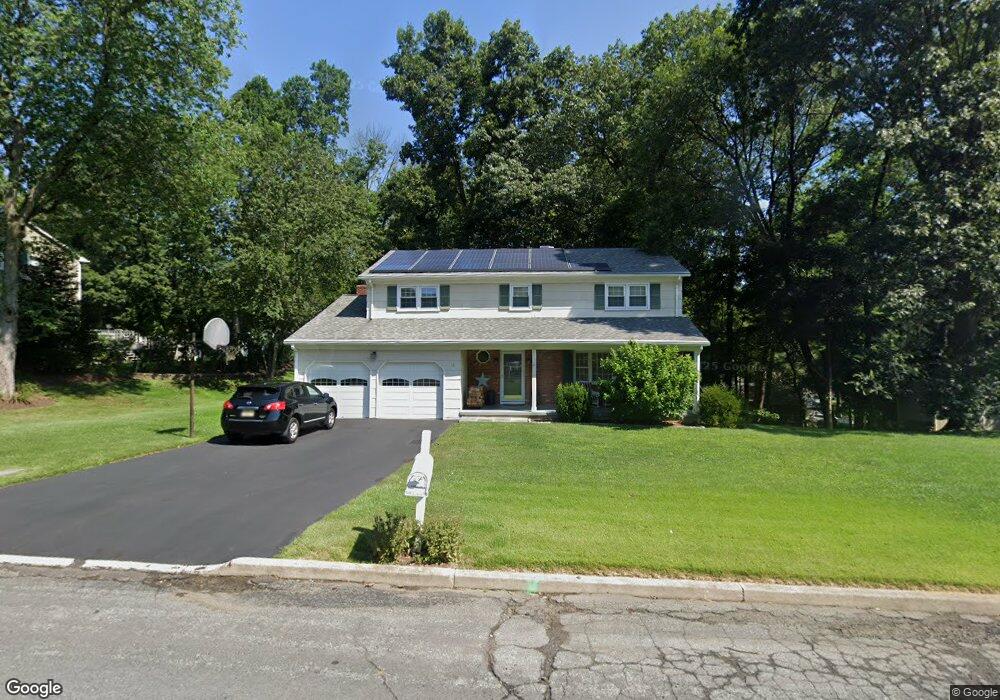
13 Sunset Dr High Bridge, NJ 08829
Estimated Value: $571,075 - $650,000
--
Bed
--
Bath
2,093
Sq Ft
$295/Sq Ft
Est. Value
About This Home
This home is located at 13 Sunset Dr, High Bridge, NJ 08829 and is currently estimated at $617,019, approximately $294 per square foot. 13 Sunset Dr is a home located in Hunterdon County with nearby schools including High Bridge Elementary School, High Bridge Middle School, and Voorhees High School.
Ownership History
Date
Name
Owned For
Owner Type
Purchase Details
Closed on
Jun 30, 2003
Sold by
Bolling Matthias R
Bought by
Tursi Alexander Andrew and Tursi Patricia Marie
Current Estimated Value
Home Financials for this Owner
Home Financials are based on the most recent Mortgage that was taken out on this home.
Original Mortgage
$230,000
Outstanding Balance
$99,772
Interest Rate
5.53%
Estimated Equity
$517,247
Purchase Details
Closed on
Aug 27, 1997
Sold by
Gottlemoeller Michael
Bought by
Bolling Matchias R and Bolling Katherine J
Home Financials for this Owner
Home Financials are based on the most recent Mortgage that was taken out on this home.
Original Mortgage
$158,000
Interest Rate
7.36%
Purchase Details
Closed on
May 27, 1993
Sold by
Sugalski Raymond W and Sugalski Patricia R
Bought by
Gottemoller Michael J and Gottemoller Janet L
Create a Home Valuation Report for This Property
The Home Valuation Report is an in-depth analysis detailing your home's value as well as a comparison with similar homes in the area
Home Values in the Area
Average Home Value in this Area
Purchase History
| Date | Buyer | Sale Price | Title Company |
|---|---|---|---|
| Tursi Alexander Andrew | $330,000 | -- | |
| Bolling Matchias R | $198,000 | -- | |
| Gottemoller Michael J | $178,000 | -- |
Source: Public Records
Mortgage History
| Date | Status | Borrower | Loan Amount |
|---|---|---|---|
| Open | Tursi Alexander Andrew | $230,000 | |
| Previous Owner | Bolling Matchias R | $158,000 |
Source: Public Records
Tax History Compared to Growth
Tax History
| Year | Tax Paid | Tax Assessment Tax Assessment Total Assessment is a certain percentage of the fair market value that is determined by local assessors to be the total taxable value of land and additions on the property. | Land | Improvement |
|---|---|---|---|---|
| 2025 | $14,926 | $453,200 | $204,000 | $249,200 |
| 2024 | $14,017 | $457,300 | $144,800 | $312,500 |
| 2023 | $14,017 | $354,500 | $123,000 | $231,500 |
| 2022 | $11,978 | $281,500 | $109,000 | $172,500 |
| 2021 | $11,749 | $282,100 | $109,000 | $173,100 |
| 2020 | $11,615 | $283,300 | $109,000 | $174,300 |
| 2019 | $11,749 | $284,400 | $109,000 | $175,400 |
| 2018 | $11,318 | $285,600 | $109,000 | $176,600 |
| 2017 | $10,984 | $285,000 | $105,000 | $180,000 |
| 2016 | $10,856 | $285,000 | $105,000 | $180,000 |
| 2015 | $10,562 | $285,000 | $105,000 | $180,000 |
| 2014 | $10,609 | $309,400 | $139,000 | $170,400 |
Source: Public Records
Map
Nearby Homes