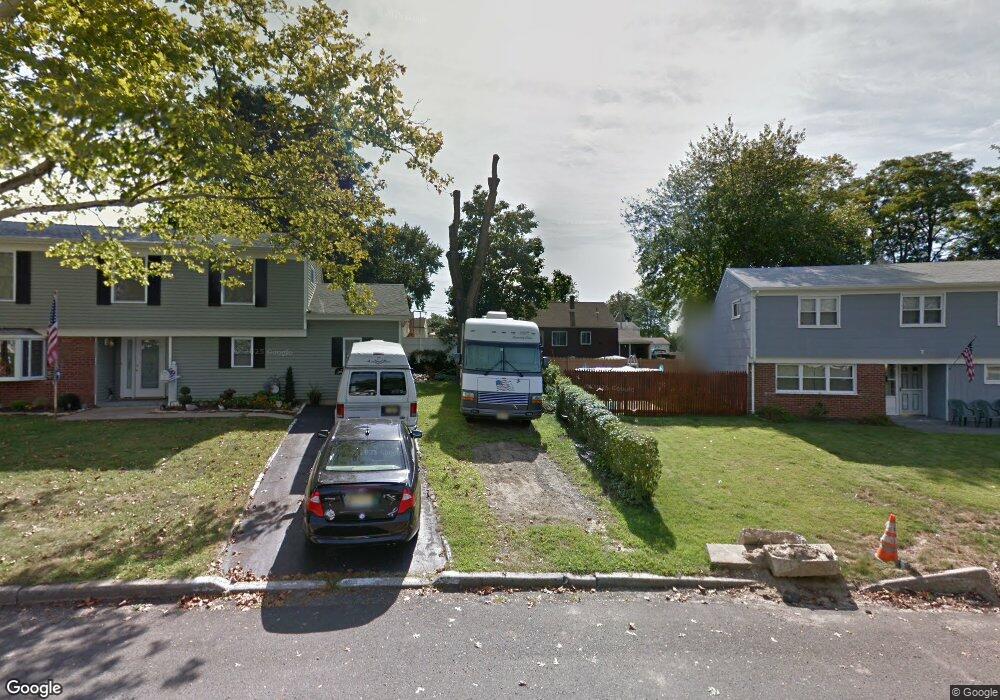
13 Sycamore Dr Old Bridge, NJ 08857
Estimated Value: $534,000 - $581,000
3
Beds
1
Bath
1,408
Sq Ft
$397/Sq Ft
Est. Value
About This Home
This home is located at 13 Sycamore Dr, Old Bridge, NJ 08857 and is currently estimated at $559,018, approximately $397 per square foot. 13 Sycamore Dr is a home located in Middlesex County with nearby schools including Old Bridge High School, St. Thomas the Apostle School, and Calvary Christian School.
Ownership History
Date
Name
Owned For
Owner Type
Purchase Details
Closed on
Aug 28, 2020
Sold by
Mcgivney John and Byrnes Donna
Bought by
Ramush Dzengis
Current Estimated Value
Home Financials for this Owner
Home Financials are based on the most recent Mortgage that was taken out on this home.
Original Mortgage
$315,250
Interest Rate
2.8%
Mortgage Type
New Conventional
Purchase Details
Closed on
Jun 1, 2017
Sold by
Canton Ajcqueline
Bought by
Canton Jacqueline and Frankfurt Debra
Create a Home Valuation Report for This Property
The Home Valuation Report is an in-depth analysis detailing your home's value as well as a comparison with similar homes in the area
Home Values in the Area
Average Home Value in this Area
Purchase History
| Date | Buyer | Sale Price | Title Company |
|---|---|---|---|
| Ramush Dzengis | $348,000 | American Title | |
| Freire Ivan B | $325,000 | Land Title | |
| Canton Jacqueline | -- | None Available |
Source: Public Records
Mortgage History
| Date | Status | Borrower | Loan Amount |
|---|---|---|---|
| Previous Owner | Freire Ivan B | $315,250 | |
| Previous Owner | Ramush Dzengis | $341,696 |
Source: Public Records
Tax History Compared to Growth
Tax History
| Year | Tax Paid | Tax Assessment Tax Assessment Total Assessment is a certain percentage of the fair market value that is determined by local assessors to be the total taxable value of land and additions on the property. | Land | Improvement |
|---|---|---|---|---|
| 2025 | $6,991 | $123,800 | $50,300 | $73,500 |
| 2024 | $6,706 | $123,800 | $50,300 | $73,500 |
| 2023 | $6,706 | $123,800 | $50,300 | $73,500 |
| 2022 | $6,553 | $123,800 | $50,300 | $73,500 |
| 2021 | $4,747 | $123,800 | $50,300 | $73,500 |
| 2020 | $6,110 | $123,800 | $50,300 | $73,500 |
| 2019 | $6,252 | $123,800 | $50,300 | $73,500 |
| 2018 | $5,933 | $123,800 | $50,300 | $73,500 |
| 2017 | $5,732 | $123,800 | $50,300 | $73,500 |
| 2016 | $5,858 | $123,800 | $50,300 | $73,500 |
| 2015 | $5,507 | $123,800 | $50,300 | $73,500 |
| 2014 | $5,449 | $123,800 | $50,300 | $73,500 |
Source: Public Records
Map
Nearby Homes