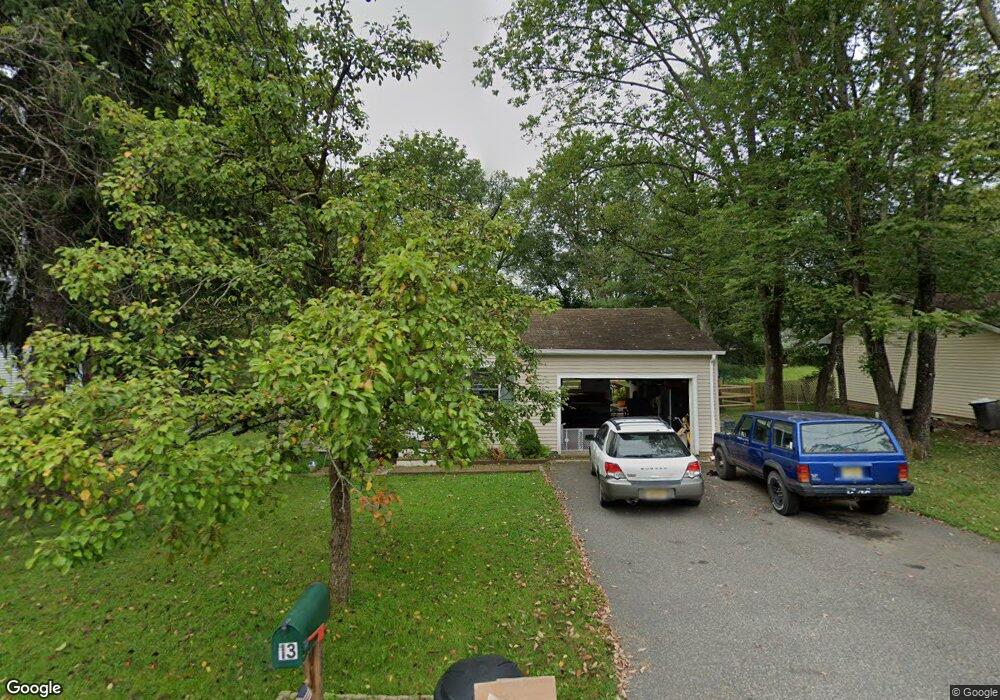
13 Sylvan Rd High Bridge, NJ 08829
Estimated Value: $283,000 - $352,000
Studio
--
Bath
912
Sq Ft
$360/Sq Ft
Est. Value
About This Home
This home is located at 13 Sylvan Rd, High Bridge, NJ 08829 and is currently estimated at $328,476, approximately $360 per square foot. 13 Sylvan Rd is a home located in Hunterdon County with nearby schools including High Bridge Elementary School, High Bridge Middle School, and Voorhees High School.
Ownership History
Date
Name
Owned For
Owner Type
Purchase Details
Closed on
Sep 4, 2018
Sold by
Dugan Brent N
Bought by
Biedron Marc E and Biedron Ashlie A
Current Estimated Value
Home Financials for this Owner
Home Financials are based on the most recent Mortgage that was taken out on this home.
Original Mortgage
$199,500
Outstanding Balance
$173,617
Interest Rate
4.5%
Mortgage Type
New Conventional
Estimated Equity
$154,859
Purchase Details
Closed on
Nov 21, 1994
Sold by
Okeefe Timothy and Okeefe Cynthia
Bought by
Ackerman Mark R and Ackerman Cherie L
Create a Home Valuation Report for This Property
The Home Valuation Report is an in-depth analysis detailing your home's value as well as a comparison with similar homes in the area
Home Values in the Area
Average Home Value in this Area
Purchase History
| Date | Buyer | Sale Price | Title Company |
|---|---|---|---|
| Biedron Marc E | $210,000 | Suburban Title Examiners Inc | |
| Ackerman Mark R | $122,000 | -- |
Source: Public Records
Mortgage History
| Date | Status | Borrower | Loan Amount |
|---|---|---|---|
| Open | Biedron Marc E | $199,500 |
Source: Public Records
Tax History
| Year | Tax Paid | Tax Assessment Tax Assessment Total Assessment is a certain percentage of the fair market value that is determined by local assessors to be the total taxable value of land and additions on the property. | Land | Improvement |
|---|---|---|---|---|
| 2025 | $9,009 | $232,600 | $163,600 | $69,000 |
| 2024 | $8,181 | $276,000 | $128,900 | $147,100 |
Source: Public Records
Map
Nearby Homes
Your Personal Tour Guide
Ask me questions while you tour the home.