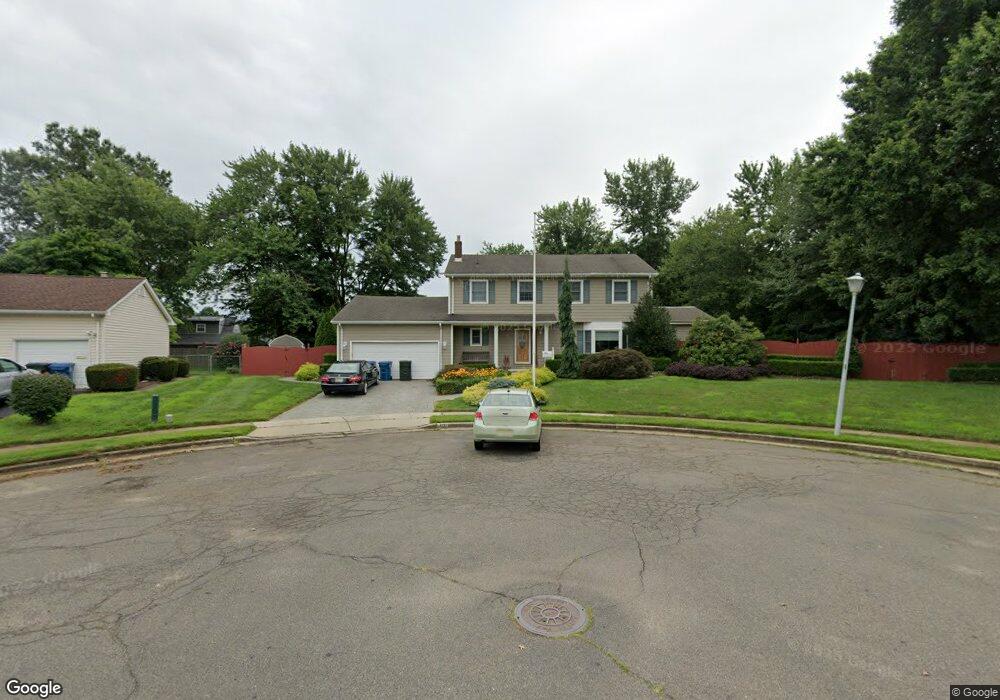
13 Tara Lin Dr Hazlet, NJ 07730
Estimated Value: $635,000 - $699,000
4
Beds
3
Baths
2,314
Sq Ft
$292/Sq Ft
Est. Value
About This Home
This home is located at 13 Tara Lin Dr, Hazlet, NJ 07730 and is currently estimated at $674,564, approximately $291 per square foot. 13 Tara Lin Dr is a home located in Monmouth County with nearby schools including Raritan High School and Baytul-Iman Academy.
Ownership History
Date
Name
Owned For
Owner Type
Purchase Details
Closed on
Sep 6, 2013
Sold by
Immordino John Leonard
Bought by
Immordino Tamara A
Current Estimated Value
Purchase Details
Closed on
Aug 1, 2003
Sold by
Sweeney Michael
Bought by
Shaw Robert and Shaw Denise
Home Financials for this Owner
Home Financials are based on the most recent Mortgage that was taken out on this home.
Original Mortgage
$150,000
Interest Rate
6.15%
Create a Home Valuation Report for This Property
The Home Valuation Report is an in-depth analysis detailing your home's value as well as a comparison with similar homes in the area
Home Values in the Area
Average Home Value in this Area
Purchase History
| Date | Buyer | Sale Price | Title Company |
|---|---|---|---|
| Immordino Tamara A | -- | None Available | |
| Shaw Robert | $300,000 | -- |
Source: Public Records
Mortgage History
| Date | Status | Borrower | Loan Amount |
|---|---|---|---|
| Previous Owner | Shaw Robert | $150,000 |
Source: Public Records
Tax History Compared to Growth
Tax History
| Year | Tax Paid | Tax Assessment Tax Assessment Total Assessment is a certain percentage of the fair market value that is determined by local assessors to be the total taxable value of land and additions on the property. | Land | Improvement |
|---|---|---|---|---|
| 2025 | $11,588 | $587,300 | $326,700 | $260,600 |
| 2024 | $11,360 | $551,000 | $291,500 | $259,500 |
| 2023 | $11,360 | $531,600 | $274,400 | $257,200 |
| 2022 | $11,278 | $464,800 | $238,300 | $226,500 |
| 2021 | $11,278 | $439,700 | $238,300 | $201,400 |
| 2020 | $11,090 | $429,500 | $232,600 | $196,900 |
| 2019 | $10,885 | $415,000 | $219,300 | $195,700 |
| 2018 | $10,686 | $404,000 | $217,400 | $186,600 |
| 2017 | $10,360 | $391,700 | $210,800 | $180,900 |
| 2016 | $10,203 | $387,200 | $210,800 | $176,400 |
| 2015 | $10,028 | $381,600 | $209,800 | $171,800 |
| 2014 | $10,295 | $367,400 | $189,900 | $177,500 |
Source: Public Records
Map
Nearby Homes
- 40 Lynn Blvd
- 1213 New Jersey 36
- 34 Hemlock St
- 21 Hemlock St
- 413 Sullivan Place
- 1 Ramble Way
- 13 Irwin Place
- 51 Sams Trailer Ct
- 525 Washington Ave
- 8 Lynn Blvd
- 425 Clark Ave
- 26 Nevada Dr
- 650 Washington Ave
- 1319 Union Ave
- 628 Morningside Ave
- 9 Scholer Dr
- 308 Stone Rd
- 1217 Union Ave
- 51 Angela Cir
- 631 Sydney Ave