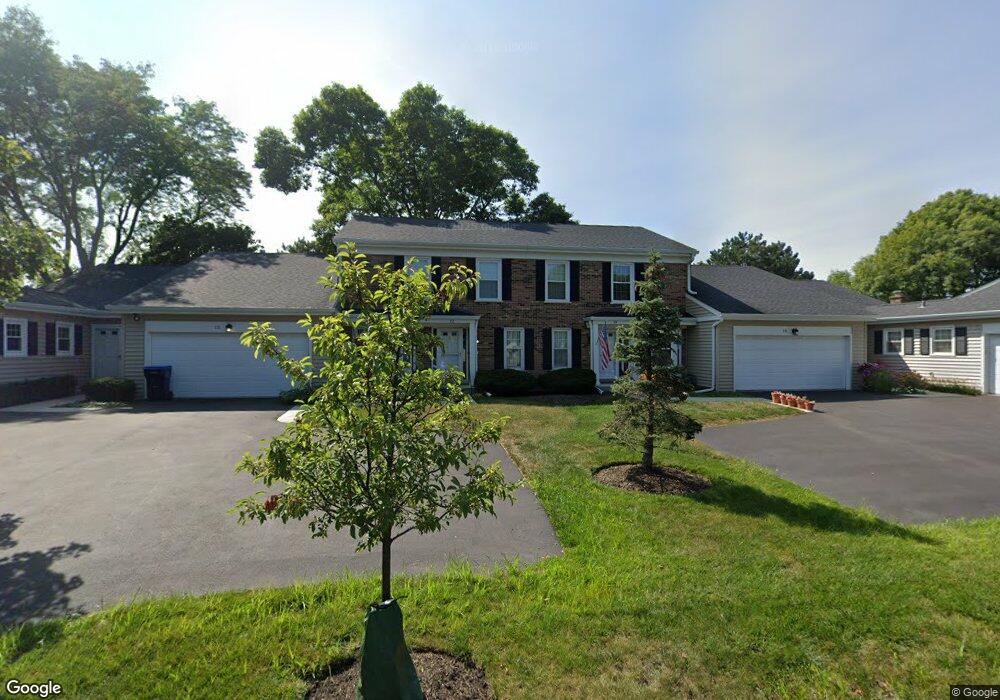
13 The Court of Greenway Unit 193 Northbrook, IL 60062
Estimated Value: $415,081 - $499,000
3
Beds
2
Baths
6,012
Sq Ft
$78/Sq Ft
Est. Value
About This Home
This home is located at 13 The Court of Greenway Unit 193, Northbrook, IL 60062 and is currently estimated at $467,270, approximately $77 per square foot. 13 The Court of Greenway Unit 193 is a home located in Cook County with nearby schools including Hickory Point Elementary School, Shabonee Elementary School, and Wood Oaks Jr High School.
Ownership History
Date
Name
Owned For
Owner Type
Purchase Details
Closed on
Nov 15, 2021
Sold by
San Gabino Elio and San Gabino Deborah
Bought by
San Gabino Elio J and San Gabino Debriah
Current Estimated Value
Purchase Details
Closed on
Jul 31, 2017
Sold by
Sommerfield Maurisa and Sommerfield Craig L
Bought by
San Gabino Deborah San and San Gabino Elio
Home Financials for this Owner
Home Financials are based on the most recent Mortgage that was taken out on this home.
Original Mortgage
$160,000
Outstanding Balance
$133,759
Interest Rate
4.03%
Mortgage Type
New Conventional
Estimated Equity
$333,511
Purchase Details
Closed on
Aug 14, 2012
Sold by
Sommerfield Mitzi
Bought by
Sommerfield Maurisa and Sommerfield Craig L
Create a Home Valuation Report for This Property
The Home Valuation Report is an in-depth analysis detailing your home's value as well as a comparison with similar homes in the area
Home Values in the Area
Average Home Value in this Area
Purchase History
| Date | Buyer | Sale Price | Title Company |
|---|---|---|---|
| San Gabino Elio J | -- | Attorney | |
| San Gabino Deborah San | $320,000 | None Available | |
| Sommerfield Maurisa | -- | None Available | |
| Sommerfield Mitzi | -- | None Available |
Source: Public Records
Mortgage History
| Date | Status | Borrower | Loan Amount |
|---|---|---|---|
| Open | San Gabino Deborah San | $160,000 |
Source: Public Records
Tax History Compared to Growth
Tax History
| Year | Tax Paid | Tax Assessment Tax Assessment Total Assessment is a certain percentage of the fair market value that is determined by local assessors to be the total taxable value of land and additions on the property. | Land | Improvement |
|---|---|---|---|---|
| 2024 | $4,008 | $28,688 | $6,787 | $21,901 |
| 2023 | $3,994 | $28,688 | $6,787 | $21,901 |
| 2022 | $3,994 | $28,688 | $6,787 | $21,901 |
| 2021 | $4,370 | $28,737 | $6,324 | $22,413 |
| 2020 | $4,010 | $28,737 | $6,324 | $22,413 |
| 2019 | $3,938 | $31,561 | $6,324 | $25,237 |
| 2018 | $4,291 | $23,988 | $5,475 | $18,513 |
| 2017 | $5,619 | $23,988 | $5,475 | $18,513 |
| 2016 | $5,270 | $23,988 | $5,475 | $18,513 |
| 2015 | $5,452 | $22,336 | $4,550 | $17,786 |
| 2014 | $5,320 | $22,336 | $4,550 | $17,786 |
| 2013 | $5,581 | $24,112 | $4,550 | $19,562 |
Source: Public Records
Map
Nearby Homes
- 47 The Court of Greenway Unit 121
- 3 The Court of Harborside Unit 111
- 8 The Court of Charlwood
- 9 the Court of Lagoon View
- 1331 Adirondack Dr Unit 1
- 3110 Pheasant Creek Dr Unit 101
- 3110 Pheasant Creek Dr Unit 206
- 3110 Pheasant Creek Dr Unit A
- 1012 Sussex Dr Unit 1012
- 1039 Sussex Dr Unit 1039
- 1400 Kingsport Ct
- 3070 Pheasant Creek Dr Unit 201
- 3050 Pheasant Creek Dr Unit 301
- 3030 Pheasant Creek Dr Unit 207
- 3030 Pheasant Creek Dr Unit 102
- 1415 Chartres Dr Unit 1F
- 1421 Chartres Dr
- 1696 Highland Ave
- 3622 Dauphine Ave
- 2814 Crimson Ct
- 12 The Court of Greenway Unit 192
- 14 The Court of Greenway Unit 191
- 14 The Court of Greenway Unit 14
- 14 The Court of Greenway Unit 14
- 11 The Court of Greenway Unit 194
- 15 The Court of Greenway Unit 183
- 16 The Court of Greenway Unit 182
- 7 The Court of Greenway Unit 1101
- 17 The Court of Greenway Unit 181
- 10 The Court of Greenway Unit 1104
- 8 The Court of Greenway Unit 1103
- 9 The Court of Greenway Unit 1102
- 18 The Court of Greenway Unit 171
- 18 The Court of Greenway
- 11 Harborside Dr Unit 1111
- 21 The Court of Greenway Unit 174
- 21 The Court of Greenway Unit 21
- 10 Harborside Dr
- 19 The Court of Greenway Unit 172
- 10 The ct of Harborside Unit 1112