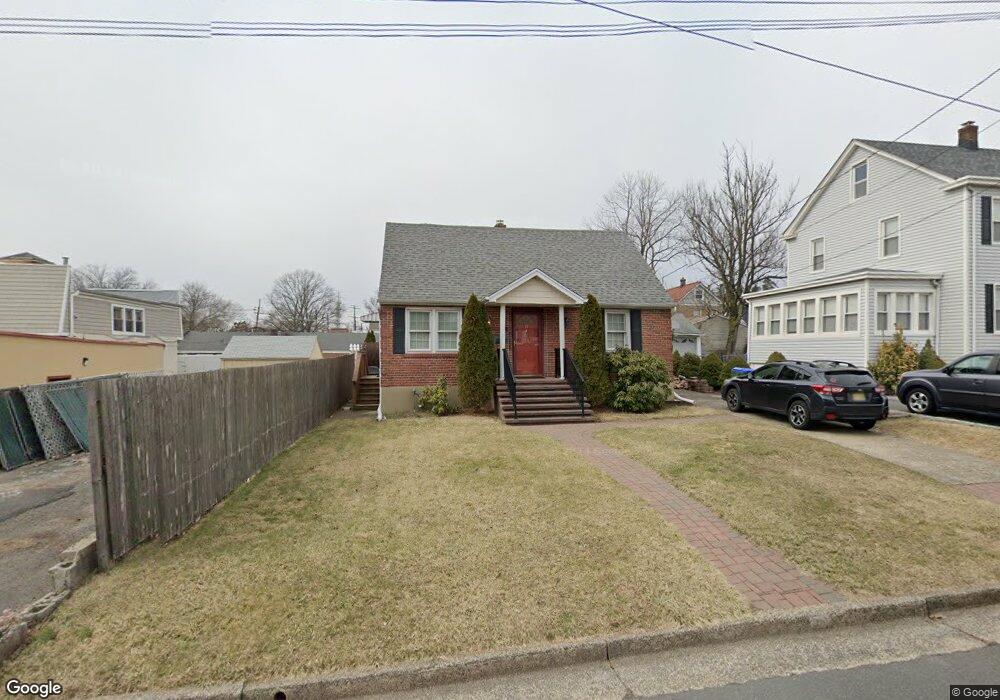
13 Third St Edison, NJ 08837
Estimated Value: $465,586 - $506,000
3
Beds
2
Baths
720
Sq Ft
$671/Sq Ft
Est. Value
About This Home
This home is located at 13 Third St, Edison, NJ 08837 and is currently estimated at $483,397, approximately $671 per square foot. 13 Third St is a home located in Middlesex County with nearby schools including James Monroe Elementary School, Herbert Hoover Middle School, and Edison High School.
Ownership History
Date
Name
Owned For
Owner Type
Purchase Details
Closed on
Nov 13, 2019
Sold by
Dunphy Anne and Estate Of Valmore P Boily
Bought by
Murray Ryan James
Current Estimated Value
Home Financials for this Owner
Home Financials are based on the most recent Mortgage that was taken out on this home.
Original Mortgage
$233,600
Outstanding Balance
$205,096
Interest Rate
3.5%
Mortgage Type
New Conventional
Estimated Equity
$278,301
Purchase Details
Closed on
Aug 31, 2005
Sold by
Critelli Richard
Bought by
Valmore Paul and Boily Mary
Purchase Details
Closed on
Mar 27, 2002
Sold by
Lipnick Mildred
Bought by
Critelli Richard
Home Financials for this Owner
Home Financials are based on the most recent Mortgage that was taken out on this home.
Original Mortgage
$165,600
Interest Rate
6.85%
Create a Home Valuation Report for This Property
The Home Valuation Report is an in-depth analysis detailing your home's value as well as a comparison with similar homes in the area
Home Values in the Area
Average Home Value in this Area
Purchase History
| Date | Buyer | Sale Price | Title Company |
|---|---|---|---|
| Murray Ryan James | $292,000 | Westcor Land Title Ins Co | |
| Valmore Paul | $312,000 | -- | |
| Critelli Richard | $184,500 | -- |
Source: Public Records
Mortgage History
| Date | Status | Borrower | Loan Amount |
|---|---|---|---|
| Open | Murray Ryan James | $233,600 | |
| Previous Owner | Critelli Richard | $165,600 |
Source: Public Records
Tax History
| Year | Tax Paid | Tax Assessment Tax Assessment Total Assessment is a certain percentage of the fair market value that is determined by local assessors to be the total taxable value of land and additions on the property. | Land | Improvement |
|---|---|---|---|---|
| 2025 | $7,036 | $120,000 | $75,000 | $45,000 |
| 2024 | $6,999 | $118,200 | $75,000 | $43,200 |
Source: Public Records
Map
Nearby Homes
- 162 Brower Ave
- 152 Fourth St
- 191 Hoover Ave
- 212 Echo Ave
- 18A Garfield Park
- 18 Garfield Park Unit A
- 12 Garfield Park Unit A
- 2 Garfield Park
- 99 Liddle Ave Unit B10
- 81 Liddle Ave
- 23 Carlton St
- 23 Carlton St S
- 16 Hallo St
- 62 Harmon Rd
- 84 Heman St
- 51 Dartmouth St
- 3181 Woodbridge Ave
- 2 Goodwill Place
- 26 Goodwill Place
- 13 Albany St
Your Personal Tour Guide
Ask me questions while you tour the home.