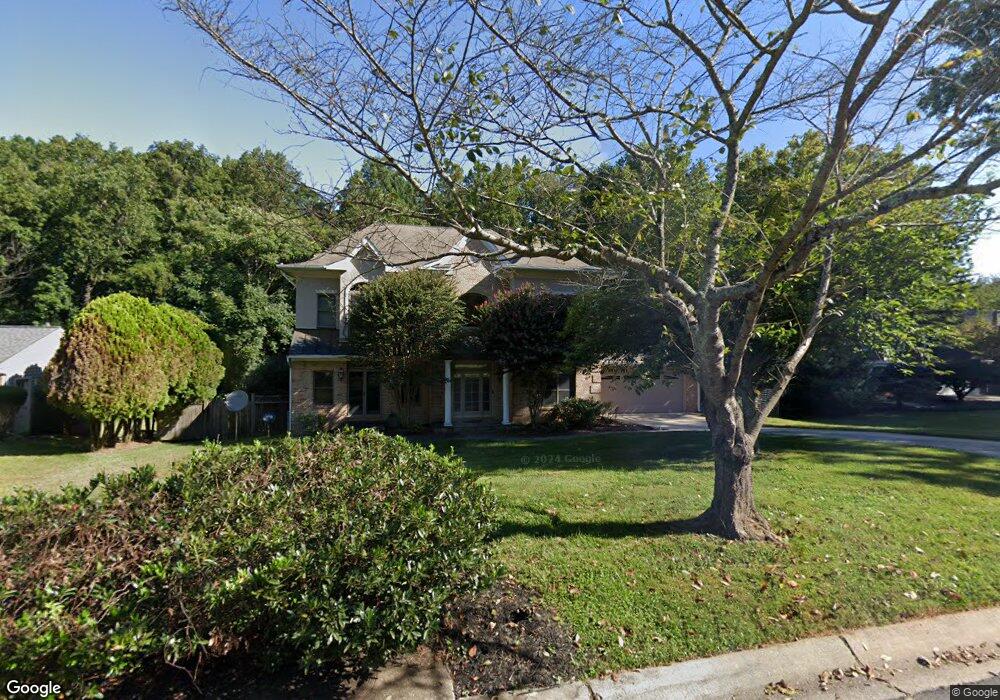
13 Trailridge Ct Potomac, MD 20854
Estimated Value: $1,571,000 - $1,879,000
5
Beds
6
Baths
3,707
Sq Ft
$449/Sq Ft
Est. Value
About This Home
This home is located at 13 Trailridge Ct, Potomac, MD 20854 and is currently estimated at $1,662,658, approximately $448 per square foot. 13 Trailridge Ct is a home located in Montgomery County with nearby schools including Wayside Elementary School, Herbert Hoover Middle School, and Winston Churchill High School.
Ownership History
Date
Name
Owned For
Owner Type
Purchase Details
Closed on
Mar 30, 2011
Sold by
Vargas Angel
Bought by
Moshasha Reza Roosta Hengameh
Current Estimated Value
Home Financials for this Owner
Home Financials are based on the most recent Mortgage that was taken out on this home.
Original Mortgage
$162,250
Outstanding Balance
$135,200
Interest Rate
4.99%
Mortgage Type
Credit Line Revolving
Estimated Equity
$1,527,458
Purchase Details
Closed on
Mar 24, 2011
Sold by
Vargas Angel
Bought by
Moshasha Reza Roosta Hengameh
Home Financials for this Owner
Home Financials are based on the most recent Mortgage that was taken out on this home.
Original Mortgage
$162,250
Outstanding Balance
$135,200
Interest Rate
4.99%
Mortgage Type
Credit Line Revolving
Estimated Equity
$1,527,458
Purchase Details
Closed on
Dec 30, 2002
Sold by
Wilson Betty J
Bought by
Vargas Angel and Vargas Cristina Miranda
Purchase Details
Closed on
Jun 20, 2000
Sold by
Smith V Randall V and Smith A P
Bought by
Wilson Burton J and Wilson J B
Create a Home Valuation Report for This Property
The Home Valuation Report is an in-depth analysis detailing your home's value as well as a comparison with similar homes in the area
Home Values in the Area
Average Home Value in this Area
Purchase History
| Date | Buyer | Sale Price | Title Company |
|---|---|---|---|
| Moshasha Reza Roosta Hengameh | $1,115,000 | -- | |
| Moshasha Reza | $1,115,000 | -- | |
| Moshasha Reza Roosta Hengameh | $1,115,000 | -- | |
| Moshasha Reza | $1,115,000 | -- | |
| Vargas Angel | $535,000 | -- | |
| Wilson Burton J | $431,000 | -- |
Source: Public Records
Mortgage History
| Date | Status | Borrower | Loan Amount |
|---|---|---|---|
| Open | Moshasha Reza | $162,250 | |
| Closed | Moshasha Reza Roosta Hengameh | $162,250 | |
| Open | Moshasha Reza | $729,750 | |
| Closed | Moshasha Reza Roosta Hengameh | $729,750 | |
| Closed | Moshasha Reza | $729,750 |
Source: Public Records
Tax History Compared to Growth
Tax History
| Year | Tax Paid | Tax Assessment Tax Assessment Total Assessment is a certain percentage of the fair market value that is determined by local assessors to be the total taxable value of land and additions on the property. | Land | Improvement |
|---|---|---|---|---|
| 2025 | $16,073 | $1,407,900 | $483,500 | $924,400 |
| 2024 | $16,073 | $1,331,533 | $0 | $0 |
| 2023 | $15,859 | $1,255,167 | $0 | $0 |
| 2022 | $12,970 | $1,178,800 | $483,500 | $695,300 |
| 2021 | $12,845 | $1,174,433 | $0 | $0 |
| 2020 | $12,761 | $1,170,067 | $0 | $0 |
| 2019 | $12,679 | $1,165,700 | $483,500 | $682,200 |
| 2018 | $12,504 | $1,150,133 | $0 | $0 |
| 2017 | $12,644 | $1,134,567 | $0 | $0 |
| 2016 | -- | $1,119,000 | $0 | $0 |
| 2015 | $12,240 | $1,119,000 | $0 | $0 |
| 2014 | $12,240 | $1,119,000 | $0 | $0 |
Source: Public Records
Map
Nearby Homes
- 11905 Ambleside Dr
- 12313 Saint James Rd
- 9329 Bentridge Ave
- 11613 Bedfordshire Ave
- 12051 Gatewater Dr
- 6 Le Havre Ct
- 9605 Barkston Ct
- 8849 Tuckerman Ln
- 9210 Marseille Dr
- Lot 4 Newgate Rd
- Lot 2 Newgate Rd
- Lot 1 Newgate Rd
- 10104 Colebrook Ave
- 12311 Overpond Way
- Lot 4 Circle Dr & Newgate Rd
- 12624 Orchard Brook Terrace
- 9537 Fox Hollow Dr
- 11141 Broad Green Dr
- 12508 Grey Fox Ln
- 9325 Orchard Brook Dr
- 9 Trailridge Ct
- 17 Trailridge Ct
- 5 Trailridge Ct
- 21 Trailridge Ct
- 9637 Reach Rd
- 18 Trailridge Ct
- 9649 Reach Rd
- 14 Trailridge Ct
- 9645 Reach Rd
- 11904 Trailridge Dr
- 22 Trailridge Ct
- 1 Trailridge Ct
- 9653 Reach Rd
- 25 Trailridge Ct
- 10 Trailridge Ct
- 9641 Reach Rd
- 9633 Reach Rd
- 6 Trailridge Ct
- 9657 Reach Rd
- 26 Trailridge Ct