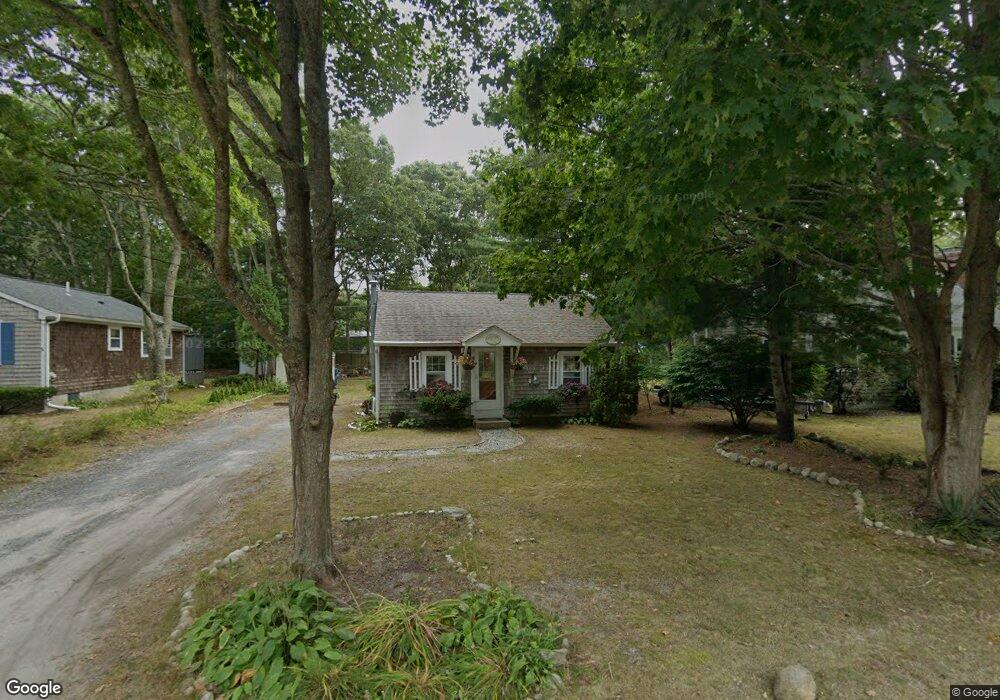
13 Veeder Dr East Falmouth, MA 02536
Estimated Value: $292,000 - $416,000
2
Beds
1
Bath
624
Sq Ft
$604/Sq Ft
Est. Value
About This Home
This home is located at 13 Veeder Dr, East Falmouth, MA 02536 and is currently estimated at $376,899, approximately $604 per square foot. 13 Veeder Dr is a home located in Barnstable County with nearby schools including Teaticket Elementary School, Morse Pond School, and Lawrence School.
Ownership History
Date
Name
Owned For
Owner Type
Purchase Details
Closed on
May 3, 2018
Sold by
Fanning Colleen
Bought by
Fanning Colleen A and Grimes Brian D
Current Estimated Value
Home Financials for this Owner
Home Financials are based on the most recent Mortgage that was taken out on this home.
Original Mortgage
$154,500
Outstanding Balance
$132,898
Interest Rate
4.45%
Mortgage Type
New Conventional
Estimated Equity
$244,001
Purchase Details
Closed on
Nov 16, 2017
Sold by
Fanning Salyan Est and Fanning
Bought by
Fanning Colleen
Purchase Details
Closed on
Apr 1, 2015
Sold by
Fanning Salyan D
Bought by
S Downing Fanning Ret and Fanning
Create a Home Valuation Report for This Property
The Home Valuation Report is an in-depth analysis detailing your home's value as well as a comparison with similar homes in the area
Home Values in the Area
Average Home Value in this Area
Purchase History
| Date | Buyer | Sale Price | Title Company |
|---|---|---|---|
| Fanning Colleen A | -- | -- | |
| Fanning Colleen A | -- | -- | |
| Fanning Colleen | -- | -- | |
| Fanning Colleen | -- | -- | |
| S Downing Fanning Ret | -- | -- | |
| S Downing Fanning Ret | -- | -- |
Source: Public Records
Mortgage History
| Date | Status | Borrower | Loan Amount |
|---|---|---|---|
| Open | Fanning Colleen A | $154,500 | |
| Closed | Fanning Colleen A | $154,500 |
Source: Public Records
Tax History Compared to Growth
Tax History
| Year | Tax Paid | Tax Assessment Tax Assessment Total Assessment is a certain percentage of the fair market value that is determined by local assessors to be the total taxable value of land and additions on the property. | Land | Improvement |
|---|---|---|---|---|
| 2025 | $1,659 | $282,700 | $158,900 | $123,800 |
| 2024 | $1,655 | $263,600 | $144,500 | $119,100 |
| 2023 | $1,691 | $244,400 | $144,500 | $99,900 |
| 2022 | $1,572 | $195,300 | $111,000 | $84,300 |
| 2021 | $1,398 | $164,500 | $106,200 | $58,300 |
| 2020 | $1,330 | $154,800 | $96,500 | $58,300 |
| 2019 | $1,303 | $152,200 | $96,500 | $55,700 |
| 2018 | $1,189 | $138,300 | $96,500 | $41,800 |
| 2017 | $1,185 | $138,900 | $96,500 | $42,400 |
| 2016 | $1,163 | $138,900 | $96,500 | $42,400 |
| 2015 | $1,138 | $138,900 | $96,500 | $42,400 |
| 2014 | $1,185 | $145,400 | $101,500 | $43,900 |
Source: Public Records
Map
Nearby Homes